Playwright Trace Viewer: Day 7 Tutorial
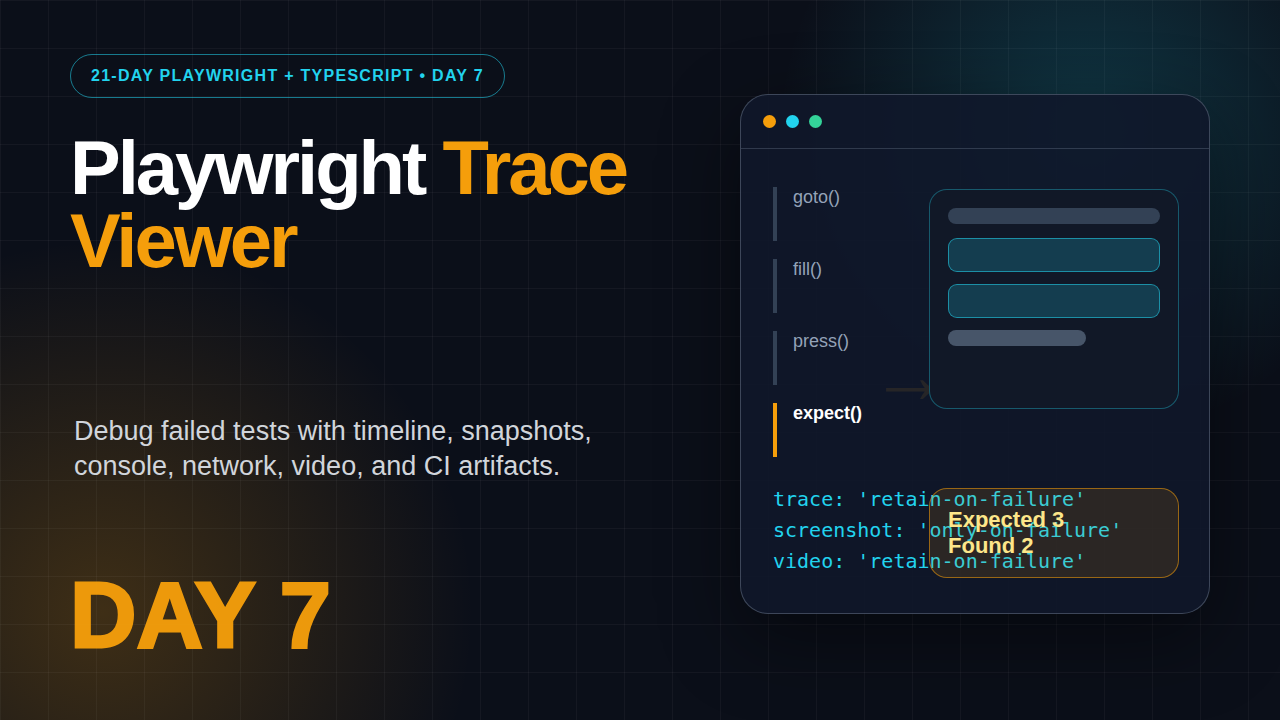
Table of Contents
🎭 Want to master this with real projects? Join the Playwright Automation Mastery course at The Testing Academy.
- Why Playwright Trace Viewer Matters on Day 7
- Project Setup for Debuggable Tests
- Record Traces Without Filling Your Disk
- How to Read a Playwright Trace Viewer File
- Debug Locally with UI Mode and VS Code
- Save Trace, Screenshot, and Video Artifacts in CI
- A Repeatable Debugging Workflow
- Common Pitfalls I See in Teams
- Key Takeaways
- FAQ
Day 7 is where your Playwright + TypeScript suite stops being a black box. Playwright Trace Viewer gives you the timeline, DOM snapshot, network calls, console messages, and action-by-action evidence you need when a test fails on your laptop or in CI.
I see many testers write decent Playwright tests and still lose hours debugging them. The issue is not Playwright. The issue is that they run tests, read the final assertion error, guess the reason, rerun, and repeat. That is slow. Today we build a debugging habit that gives you proof before you touch the code.
This tutorial continues the 21-day series after Day 1 setup, Day 2 locators and assertions, Day 5 Page Object Model, and Day 6 fixtures and hooks. By the end, you will know exactly what to capture, where to store it, and how to explain a failure to a developer without hand-waving.
Contents
Why Playwright Trace Viewer Matters on Day 7
Playwright is popular because it removes a lot of browser automation friction. As of this run, the GitHub API reports the Microsoft Playwright repository at 90,961 stars, and the npm downloads API reports 156,321,296 monthly downloads for @playwright/test from 2026-05-15 to 2026-06-13. The latest npm registry version I checked is 1.60.0. Those numbers tell me one thing: teams are not experimenting anymore. They are running serious suites.
Serious suites need serious debugging. A flaky checkout test is not just a red mark in a report. It blocks releases, wastes stand-up time, and makes product teams distrust automation. When a test fails, you need to answer four questions quickly:
- What exact action did Playwright attempt?
- What did the page look like before and after that action?
- Which network request or console error appeared around the failure?
- Was the failure caused by the test, the app, the environment, or test data?
The official Playwright docs describe Trace Viewer as a GUI tool for exploring recorded traces after a script has run. That matches how I use it. I do not treat traces as decoration. I treat them as the primary evidence file for automation failures, especially in CI where I cannot sit and watch the browser.
What a trace contains
A trace can include the action timeline, DOM snapshots, screenshots, source code locations, console logs, network activity, test errors, and attachments. This is much richer than a final screenshot. A screenshot tells you where the test died. A trace tells you how it got there.
When to use traces
Use traces when failures are hard to reproduce, when the error message is too generic, when CI behaves differently from your machine, or when a test passes in headed mode but fails in headless mode. I also enable trace collection during framework design reviews because it exposes slow selectors, repeated login flows, and weak waiting logic.
Project Setup for Debuggable Tests
A debuggable test suite starts in playwright.config.ts. If the config is messy, every engineer invents their own local flags, and CI artifacts become inconsistent. I prefer a predictable baseline: retain traces only on failures, capture screenshots on failures, record videos only when needed, and keep reports in a known folder.
// playwright.config.ts
import { defineConfig, devices } from '@playwright/test';

export default defineConfig({
  testDir: './tests',
  timeout: 30_000,
  expect: {
    timeout: 7_000,
  },
  retries: process.env.CI ? 1 : 0,
  reporter: [
    ['html', { outputFolder: 'playwright-report', open: 'never' }],
    ['list'],
  ],
  use: {
    baseURL: process.env.BASE_URL ?? 'https://demo.playwright.dev/todomvc',
    trace: 'retain-on-failure',
    screenshot: 'only-on-failure',
    video: 'retain-on-failure',
  },
  projects: [
    { name: 'chromium', use: { ...devices['Desktop Chrome'] } },
    { name: 'firefox', use: { ...devices['Desktop Firefox'] } },
  ],
});
The important line is trace: 'retain-on-failure'. It avoids storing a trace for every passing test, which can become heavy in a large suite. At the same time, it guarantees that a failed CI run leaves useful evidence behind.
Trace modes you should know
off: no trace files. Fast, but weak for diagnosis.on: trace for every test. Useful for short local experiments, risky for large CI runs.retain-on-failure: records traces, keeps only failed ones. This is my default.on-first-retry: records a trace only when a failed test is retried. Good for mature suites with retry enabled.
Screenshot description
Screenshot to capture for your notes: VS Code opened with playwright.config.ts on the left and the use block highlighted. The right terminal shows npx playwright test completing with one failure and a generated report path. This image helps beginners connect config lines to the final artifacts.
Record Traces Without Filling Your Disk
Trace files are powerful, but they are not free. A team running hundreds of tests across three browsers can generate many megabytes of artifacts in a single run. The trick is to capture enough evidence for failures without turning your CI storage into a dumping ground.
For local debugging, I often force tracing for one spec file:
npx playwright test tests/todo-debug.spec.ts --trace onAfter the test completes, open the HTML report:
npx playwright show-reportOr open a specific trace zip directly:
npx playwright show-trace test-results/todo-debug-add-item-chromium/trace.zipIn CI, I prefer retain-on-failure or on-first-retry. If the suite is new and noisy, use retain-on-failure. If the suite is stable and you only want deep evidence for flaky failures, use on-first-retry. That choice is not about style. It is about artifact cost and signal quality.
A small failing test to practice with
Create this file. It intentionally asserts the wrong count so you can generate a trace and learn the UI without waiting for a real production bug.
// tests/todo-debug.spec.ts
import { test, expect } from '@playwright/test';

test('debug a failing todo count', async ({ page }) => {
  await page.goto('/');
  await page.getByPlaceholder('What needs to be done?').fill('Write trace notes');
  await page.getByPlaceholder('What needs to be done?').press('Enter');
  await page.getByPlaceholder('What needs to be done?').fill('Review failed action');
  await page.getByPlaceholder('What needs to be done?').press('Enter');

  await expect(page.getByTestId('todo-title')).toHaveCount(3);
});
Run it with tracing on:
npx playwright test tests/todo-debug.spec.ts --project=chromium --trace onThe test should fail because there are only two items. That is fine. The goal is to open the trace and inspect the exact state at the assertion.
How to Read a Playwright Trace Viewer File
Playwright Trace Viewer can look busy the first time you open it. Do not click randomly. Read it in a fixed order. I use the same order during team reviews because it keeps the discussion factual.
- Start with the failed action or failed assertion in the timeline.
- Look at the before and after snapshots.
- Check the locator Playwright used.
- Review console messages near the failure.
- Check network requests for failed status codes or slow responses.
- Open source view only after you understand the browser state.
The timeline is your map. Each click, fill, press, navigation, and assertion appears as a step. When you select a step, the snapshot area shows what the page looked like. This is where many false assumptions die. A button may be hidden behind a modal. A spinner may still be visible. A validation message may appear for a different field than the one you expected.
Use snapshots before source code
Beginners jump straight to code. Senior SDETs inspect the page state first. If the page state is wrong, changing the assertion may only hide the bug. If the page state is correct, then you inspect the locator or expectation.
Use network tab for API-backed flows
Modern UI tests fail because data does not arrive, an API returns a validation error, or the environment has stale records. Trace Viewer gives you network visibility. If a checkout screen fails after clicking Pay, check whether the payment intent request returned success, failure, timeout, or 500. Do not guess from the final UI alone.
Screenshot description
Screenshot to capture for the article series: Trace Viewer opened on a failed assertion. The timeline highlights toHaveCount, the center panel shows two todo items, and the network tab is visible below. Add a small arrow that says: “Expected 3, page has 2.” This is the perfect teaching screenshot.
Debug Locally with UI Mode and VS Code
Trace files are excellent after a run. UI Mode and VS Code debugging help before and during a run. The official Playwright debugging docs recommend the VS Code extension for a better developer experience because you can set breakpoints, see errors, and step through tests in the editor.
Run UI Mode like this:
npx playwright test --uiUI Mode is useful when you are developing a new test. You can filter tests, run a single spec, watch actions, inspect locators, and rerun quickly. It also gives a beginner a visual understanding of Playwright actions. I use it when teaching because learners can see why a locator fails instead of reading only a terminal stack trace.
For the VS Code extension flow, install the official Playwright extension, open the Testing panel, select the browser project, set a breakpoint, and run the test in debug mode. You can inspect variables, step over code, and pause before the action that fails.
Use page.pause() sparingly
test('debug checkout form', async ({ page }) => {
  await page.goto('/checkout');
  await page.pause();
  await page.getByLabel('Email').fill('qa@example.com');
  await page.getByRole('button', { name: 'Continue' }).click();
});
page.pause() opens Playwright Inspector and lets you explore. It is great locally. Do not commit it. A committed pause will hang CI and waste everyone’s time.
Use headed mode for visual timing issues
npx playwright test tests/checkout.spec.ts --headed --project=chromiumHeaded mode helps when animation, focus, or hover behavior matters. Still, do not debug only by watching the screen. Pair headed mode with traces so you keep evidence after the run.
🚀 Level Up Your Playwright
From locators to CI pipelines — build a production-grade Playwright + TypeScript framework step by step.
Save Trace, Screenshot, and Video Artifacts in CI
A debugging workflow is incomplete until CI artifacts are easy to download. If a test fails in GitHub Actions and the trace disappears after the job ends, your team is back to guessing. Store the Playwright report and test results folder as artifacts.
# .github/workflows/playwright.yml
name: Playwright Tests

on:
  push:
    branches: [ main ]
  pull_request:
    branches: [ main ]

jobs:
  test:
    runs-on: ubuntu-latest
    steps:
      - uses: actions/checkout@v4
      - uses: actions/setup-node@v4
        with:
          node-version: 20
      - name: Install dependencies
        run: npm ci
      - name: Install Playwright browsers
        run: npx playwright install --with-deps
      - name: Run Playwright tests
        run: npx playwright test
      - name: Upload Playwright report
        if: always()
        uses: actions/upload-artifact@v4
        with:
          name: playwright-report
          path: playwright-report/
          retention-days: 7
      - name: Upload test results
        if: always()
        uses: actions/upload-artifact@v4
        with:
          name: test-results
          path: test-results/
          retention-days: 7
I keep retention low for routine branches and higher for release branches. A 7-day artifact window is enough for most pull request investigations. For a release candidate, I may keep artifacts for 14 or 30 days depending on the team’s audit needs.
What to upload
playwright-report/: human-friendly HTML report with links to traces.test-results/: trace zips, screenshots, videos, and attachments.- CI logs: useful for environment variables, base URL, browser install issues, and retries.
Do not upload secrets
Traces can contain URLs, form values, request payloads, response snippets, and screenshots. Never run production credentials through a trace-heavy test suite. Use masked test accounts and non-sensitive data. If your app displays tokens or customer data in the UI, tighten your test environment before enabling broad artifact retention.
A Repeatable Debugging Workflow
The main value of Playwright debugging is not a single command. It is the habit your team follows when red builds appear. Here is the workflow I recommend to SDETs moving from beginner to production-level automation.
- Open the CI job and confirm the failing project, browser, retry count, and spec file.
- Download the Playwright report artifact.
- Open the trace for the first failed attempt, not only the retry.
- Identify whether the failure is locator, data, network, environment, or product behavior.
- Reproduce locally with the same project and base URL if safe.
- Fix the smallest responsible layer: locator, fixture, assertion, test data, or app bug.
- Add a short note in the pull request explaining what the trace showed.
This note matters. “Fixed flaky test” is weak. “Trace showed promo modal covered the Continue button on first retry. Added a modal dismissal helper in the checkout fixture and asserted the modal is hidden before click” is strong. That is how a QA engineer earns trust in engineering discussions.
Failure classification table
| Trace symptom | Likely cause | First fix to try |
|---|---|---|
| Element exists but click times out | Overlay, animation, disabled state | Assert readiness and remove hidden overlay cause |
| Locator matches multiple elements | Weak locator | Use role, accessible name, or test id with scope |
| Network request returns 401 | Expired auth state | Regenerate storage state in setup project |
| Assertion sees old data | Test data collision | Create unique records through API fixture |
| Passes locally, fails in CI | Environment speed or config difference | Compare project config, base URL, trace snapshots |
TypeScript helper for debug attachments
Use testInfo when you need extra context. This example attaches the current URL and a small diagnostic JSON object to the report.
import { test, expect } from '@playwright/test';

test('checkout diagnostic example', async ({ page }, testInfo) => {
  await page.goto('/checkout');

  const diagnostic = {
    url: page.url(),
    project: testInfo.project.name,
    retry: testInfo.retry,
    workerIndex: testInfo.workerIndex,
  };

  await testInfo.attach('debug-context', {
    body: JSON.stringify(diagnostic, null, 2),
    contentType: 'application/json',
  });

  await expect(page.getByRole('heading', { name: 'Checkout' })).toBeVisible();
});
Do not attach everything. Attach what shortens diagnosis. A small JSON object with URL, user role, feature flag, and test data ID can save 20 minutes in a failed CI investigation.
Common Pitfalls I See in Teams
Playwright Trace Viewer is useful only when teams use it with discipline. Here are the mistakes I see when reviewing beginner and intermediate frameworks.
In India, I see this skill separate average automation profiles from strong SDET profiles. Many candidates can write page.click() and expect(). Fewer can open a trace, explain why the failure happened, classify it correctly, and propose the smallest fix. That matters in product companies where release confidence is part of the job. If you are targeting ₹25-40 LPA SDET roles, debugging evidence is a stronger story than saying you know Playwright commands.
During interviews, do not only say, “I handled flaky tests.” Explain one trace-based example. Mention the symptom, the timeline step, the network or snapshot evidence, and the code change. This gives the interviewer proof that you think like an engineer, not just a script writer.
1. Keeping traces for every test forever
This starts with good intent and becomes a storage problem. Keep all traces only for small experiments. For regular CI, retain failed traces or first retry traces.
2. Treating screenshots as enough evidence
A screenshot is one frame. A trace is the story. If your team only uploads screenshots, you will still spend time asking what happened before the screenshot.
3. Ignoring network and console panels
UI automation failures often come from API behavior. A 500 response, blocked request, CORS issue, or client-side exception can appear clearly in the trace. Check those panels before changing waits.
4. Adding random waits after every failure
// Bad debugging habit
await page.waitForTimeout(5000);
await page.getByRole('button', { name: 'Continue' }).click();
A hard wait hides the real timing condition. Replace it with a meaningful assertion:
// Better
await expect(page.getByTestId('checkout-summary')).toBeVisible();
await expect(page.getByRole('button', { name: 'Continue' })).toBeEnabled();
await page.getByRole('button', { name: 'Continue' }).click();
5. Debugging with production data
Do not put customer data in traces. Keep test environments clean. Use synthetic users, synthetic orders, and unique test records. This is basic SDET hygiene.
6. Not teaching juniors how to read traces
If one senior engineer is the only person who understands traces, the framework still has a people bottleneck. Add a 30-minute trace review to your QA onboarding. Ask each learner to explain one failed test using the timeline, snapshot, and network panel.
Key Takeaways
Playwright Trace Viewer should be part of your normal Playwright + TypeScript workflow, not an emergency tool you discover during a release blocker.
- Use
trace: 'retain-on-failure'as the practical default for most teams. - Read traces in order: timeline, snapshots, locator, console, network, then source.
- Upload
playwright-report/andtest-results/as CI artifacts. - Avoid hard waits. Use trace evidence to add precise assertions or fix test data.
- Train juniors to explain failures from evidence, not guesses.
Tomorrow we can build on this by cleaning up authentication and storage state patterns. Once debugging is solid, login reuse becomes much easier to trust.
FAQ
Is Playwright Trace Viewer only for CI failures?
No. CI failures are the strongest use case, but local debugging is also useful. Run one spec with --trace on, open the trace, and inspect the steps while the problem is fresh.
Should I enable trace on every test?
Not for normal CI. It creates too many artifacts. Use retain-on-failure or on-first-retry for a better balance between evidence and storage cost.
Can traces expose sensitive information?
Yes. Traces can contain screenshots, URLs, request details, and visible form data. Use safe test data and avoid production accounts.
What is the difference between Trace Viewer and UI Mode?
Trace Viewer helps you inspect a completed run. UI Mode helps you develop and debug interactively while running tests. I use both, but for different moments.
What should I check first when a trace opens?
Start from the failed action or assertion in the timeline. Then inspect the before and after snapshots. This usually tells you whether the issue is locator, app state, data, or environment.
Sources: Playwright Trace Viewer docs, Playwright Debugging docs, Playwright configuration docs, GitHub API for microsoft/playwright, npm downloads API for @playwright/test.
🎓 Master Playwright End to End
Join hundreds of SDETs building real automation frameworks. Lifetime access, hands-on projects, and a job-ready portfolio.