Selenium Grid Health Checks Before CI Release
Most failed Selenium suites do not fail because Selenium is broken. They fail because the Grid was unhealthy before the first test started. This guide gives you a practical Selenium Grid health checks routine to run before a CI release, so your team catches node drift, browser mismatches, queue pressure, and noisy retries before they block a deployment.
🎭 Want to master this with real projects? Join the Playwright Automation Mastery course at The Testing Academy.
Table of Contents
- Why Selenium Grid Health Checks Matter Before CI
- The Five Grid Signals I Check First
- Selenium Grid Health Checks With the Status API
- GraphQL Checks for Nodes, Slots, and Sessions
- Browser Version Drift and Docker Image Checks
- Logs, Retries, and Flaky Test Signals
- A CI Gate You Can Copy Today
- India QA Team Context
- Key Takeaways
- FAQ
Contents
Why Selenium Grid Health Checks Matter Before CI
I see teams treat Selenium Grid like plumbing. It sits in a Docker Compose file, a Kubernetes namespace, or a shared QA VM. Nobody checks it until the release pipeline turns red.
That is the wrong point to start debugging. By then, engineers are arguing about test code, developers are waiting for sign-off, and a release manager is asking whether the failure is real. A 90-second Grid check before the suite starts is cheaper than a 45-minute rerun after the suite fails.
Grid failures look like test failures
A Grid problem rarely announces itself cleanly. It usually appears as one of these symptoms:
- New session requests timing out.
- Chrome tests failing while Firefox tests pass.
- Only parallel runs failing, while local runs pass.
- Retries passing after the third attempt.
- Nodes showing as registered but not actually accepting sessions.
- Video or trace artifacts missing for failed sessions.
None of these symptoms prove your application is broken. They prove your evidence is polluted. If your CI release gate cannot separate product failures from infrastructure failures, your team starts ignoring automation results.
What Selenium documents give us
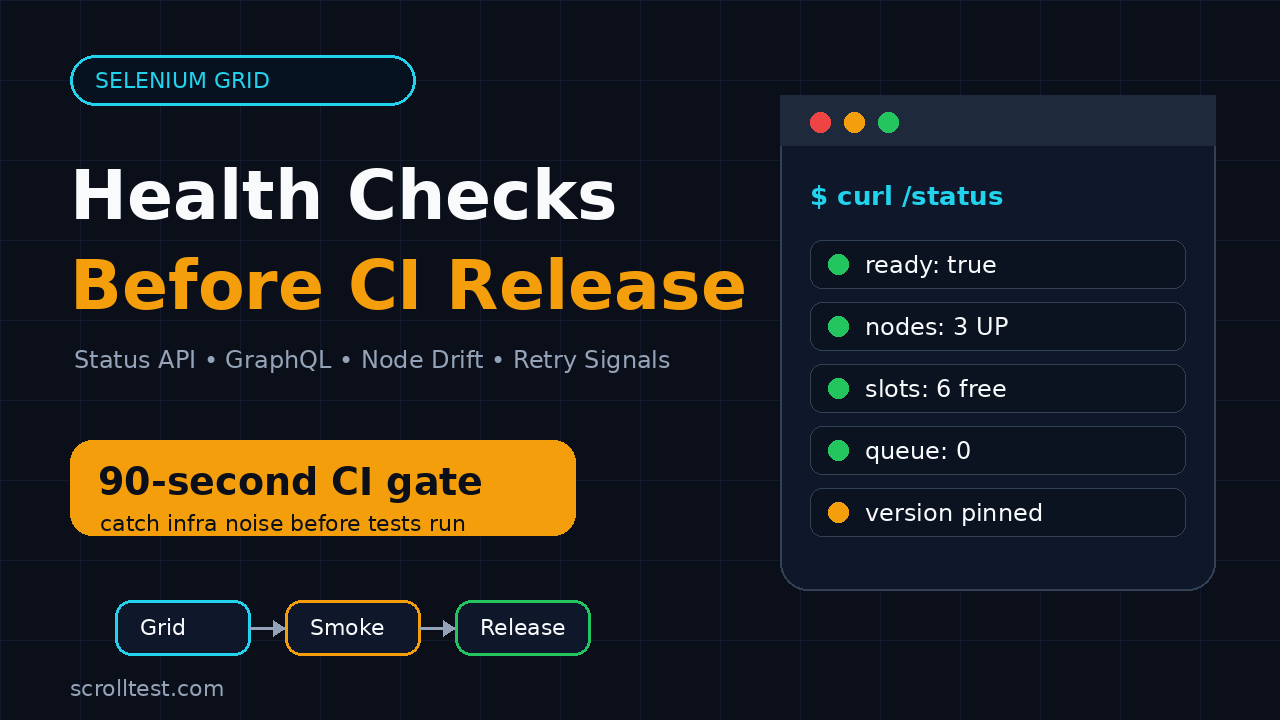
Selenium Grid is not a black box. The official Selenium Grid endpoint documentation says the Grid status endpoint returns the current Grid state, including registered nodes, node availability, sessions, and slots. The documented command is GET http://localhost:4444/status.
The Selenium Grid architecture docs also explain that nodes send heartbeats, and the Distributor checks a node’s /status endpoint regularly. That matters because your CI gate should check the same kind of signals the Grid uses internally: node availability, slot capacity, current sessions, and whether the Grid is ready to serve traffic.
The release rule I use
Before a CI release, I do not ask, “Can Selenium run?” I ask a sharper question:
Can this exact Grid, with these exact browser versions, handle this exact level of parallel test traffic right now?
That question changes the checklist. You stop checking only whether port 4444 responds. You check whether the Grid is ready, whether the nodes match the pipeline expectation, whether the queue is clean, and whether previous failures show infrastructure noise.
The Five Grid Signals I Check First
A useful Grid health check is not a long audit. It is a fast release gate. I start with five signals because they catch the majority of CI blockers without turning the pipeline into a monitoring project.
1. Readiness
Readiness answers one question: should CI send test traffic now? A basic HTTP 200 is not enough. The response body must show the Grid is ready. In Selenium Grid 4, the status response includes readiness and a message. Your gate should fail if the Grid says it is not ready.
2. Node availability
Nodes can be up, draining, or unavailable. Selenium’s GraphQL support documentation describes the node status enum values as UP, DRAINING, and UNAVAILABLE. A release run should not start if required nodes are unavailable or draining unless the pipeline intentionally reduces parallelism.
3. Slot capacity
Slots decide how many browser sessions can run at once. If your suite is configured for 12 parallel workers but the Grid has only 6 usable Chrome slots, you have already created a queue. The test code will get blamed for slowness, but the capacity math was wrong before the first spec started.
4. Browser and driver drift
Browser version drift is a silent killer. One Chrome node on version 126 and another on 127 may pass most tests, then fail on a browser-specific behavior. Selenium 4.45.0 was published on GitHub on 16 June 2026, according to the Selenium release page. That kind of release cadence means teams must pin and report the versions used in CI, not rely on memory.
5. Retry and queue pressure
Retries are not always bad. Blind retries are bad. If your run passes only after retries, the Grid check should record what happened: new session timeout, queue wait, node connection issue, browser crash, or test assertion failure. These are different problems with different owners.
Selenium Grid Health Checks With the Status API
The first practical check is the simplest: call the Grid status endpoint and parse it. This is the health check I want in every pipeline before the real suite starts.
Manual curl check
Run this against your Grid URL. Replace the host if your Grid sits behind Docker Compose, Kubernetes ingress, or a private CI service name.
GRID_URL="http://localhost:4444"

curl --fail --silent "$GRID_URL/status" | python3 -m json.tool
Do not stop at “curl succeeded.” Read the JSON. The Grid may respond while still having zero useful nodes. Your pipeline should fail fast if the response says the Grid is not ready, has no nodes, or has fewer slots than the suite needs.
Python readiness gate
Here is a small Python gate I use as a starting point. It checks readiness, counts nodes, counts free slots when the status payload exposes slot data, and prints a release-friendly reason when it fails.
#!/usr/bin/env python3
import os
import sys
import requests

GRID_URL = os.getenv("GRID_URL", "http://localhost:4444").rstrip("/")
MIN_NODES = int(os.getenv("MIN_GRID_NODES", "1"))
MIN_SLOTS = int(os.getenv("MIN_GRID_SLOTS", "1"))

resp = requests.get(f"{GRID_URL}/status", timeout=10)
resp.raise_for_status()
payload = resp.json()
value = payload.get("value", payload)

ready = value.get("ready")
message = value.get("message", "")
nodes = value.get("nodes", []) or []

slot_count = 0
for node in nodes:
    for slot in node.get("slots", []) or []:
        slot_count += 1

errors = []
if ready is not True:
    errors.append(f"Grid not ready: {message}")
if len(nodes) < MIN_NODES:
    errors.append(f"Expected {MIN_NODES} nodes, found {len(nodes)}")
if slot_count and slot_count < MIN_SLOTS:
    errors.append(f"Expected {MIN_SLOTS} slots, found {slot_count}")

if errors:
    print("Selenium Grid health check failed")
    for error in errors:
        print(f"- {error}")
    sys.exit(1)

print(f"Grid ready: nodes={len(nodes)}, slots={slot_count or 'unknown'}")
Keep this script boring. A release gate should be easy to read at 2 AM. If the script needs a wiki page to explain why it failed, it is too clever.
What to fail on
For a CI release, I fail on these conditions:
- Grid status endpoint is unreachable.
- Status response says the Grid is not ready.
- Required browser node is missing.
- Available slots are lower than configured parallelism.
- Any required node is draining or unavailable.
- Selenium, browser, or driver version does not match the release baseline.
This is stricter than a daily smoke run. That is intentional. A release pipeline should prefer a fast infrastructure failure over a noisy application failure.
GraphQL Checks for Nodes, Slots, and Sessions
The status endpoint is good for a first pass. GraphQL is better when you want focused data without parsing a large payload. Selenium’s GraphQL support documentation shows that the Grid schema exposes data such as URI, total slots, node count, max session count, session count, version, and session queue size.
Query the exact values CI needs
Here is a curl command that asks the Grid for the numbers I care about before a release run:
curl -s -X POST "http://localhost:4444/graphql" \
  -H "Content-Type: application/json" \
  --data '{"query":"{ grid { uri totalSlots nodeCount maxSession sessionCount version sessionQueueSize } }"}' \
  | python3 -m json.tool
The output gives you a compact release summary. Store it as a CI artifact. When someone asks why the suite took longer today, you can compare node count, slot count, active sessions, and queue size from previous runs.
Check for queue pressure
A non-zero session queue at the start of a release run is a warning. It may mean another team is using the same shared Grid, an old test run did not stop cleanly, or the Grid is under-provisioned.
I prefer dedicated release Grid capacity. If teams share a Grid, at least add this rule: release pipelines fail when sessionQueueSize is greater than zero before the run starts. Shared infrastructure should not make your release signal random.
Record versions in the build log
The GraphQL version field is useful because it puts the Selenium server version in the same place as the test run. Pair it with browser versions from nodes or from container metadata. If a regression appears only after a browser image update, you want the build log to show that without digging through Docker history.
Browser Version Drift and Docker Image Checks
Many teams run Selenium Grid with Docker images. That is a good default, but it adds a version management problem. If images float, your browser version can change without a code change. If images are pinned forever, you miss browser fixes and security updates.
Pin images for release pipelines
The Selenium Docker repository documents standalone, hub-node, fully distributed, video recording, dynamic Grid, and environment variable configuration. For release CI, I prefer pinned image tags and an explicit upgrade PR. Do not let a release pipeline pull a moving browser image without review.
services:
  selenium-hub:
    image: selenium/hub:4.45.0
    ports:
      - "4444:4444"

  chrome:
    image: selenium/node-chrome:4.45.0
    shm_size: 2gb
    depends_on:
      - selenium-hub
    environment:
      - SE_EVENT_BUS_HOST=selenium-hub
      - SE_EVENT_BUS_PUBLISH_PORT=4442
      - SE_EVENT_BUS_SUBSCRIBE_PORT=4443
      - SE_NODE_MAX_SESSIONS=2
The important part is not that you copy these exact versions. The important part is that your Grid version is visible, reviewed, and repeatable.
Match parallelism to real capacity
Do not set workers=20 because the test runner supports it. Set it because the Grid has enough CPU, memory, browser slots, and network stability to handle it. A cheap check is to keep a CI variable beside the Grid check:
export MIN_GRID_NODES=3
export MIN_GRID_SLOTS=6
export TEST_WORKERS=6
python3 ci/check_grid.py
npm run test:release -- --workers=$TEST_WORKERS
If the Grid has 4 slots today, the script should fail before tests start. That is not a test failure. That is a capacity failure.
Use upgrade smoke tests
If you are upgrading Selenium or browser images, run a tiny smoke pack before the full suite. I wrote a related ScrollTest checklist for teams upgrading Selenium: Selenium 4.45 Upgrade Checklist for SDETs. Use the same idea for Grid images: one login test, one navigation test, one file upload or download if your app uses it, and one test that opens a new tab or window.
🚀 Level Up Your Playwright
From locators to CI pipelines — build a production-grade Playwright + TypeScript framework step by step.
Logs, Retries, and Flaky Test Signals
Health checks should not stop when the suite starts. The pre-run gate catches obvious failures. The post-run check tells you whether the Grid behaved during the run.
Separate product failures from Grid noise
When a test fails, classify the first failure reason before retrying. I use buckets like this:
- Application assertion: expected UI or API behavior did not happen.
- Selector or wait: the test could not find or interact with an element.
- Session creation: Grid could not create a browser session.
- Browser crash: browser or driver died during execution.
- Infrastructure timeout: node, network, artifact upload, or video recorder failed.
Only the first two buckets usually belong to the product or test author. The last three belong to Grid or CI infrastructure. If your report mixes all five, retry numbers become meaningless.
Use tracing and structured logs
Selenium’s observability documentation says Selenium server is instrumented with tracing using OpenTelemetry, and each request is traced from start to end. The observability guide is worth reading if your team runs a large Grid or a shared Grid.
For small teams, start simpler. Capture Grid logs as CI artifacts. Store the status response at the start and end of the run. Store the GraphQL summary. That gives you enough evidence to avoid the lazy “flaky test” label.
Watch retry rate, not just final pass rate
A suite that passes after 37 retries is not healthy. Track retry rate per build. If the retry rate jumps after a Grid image change, a node capacity change, or a browser update, pause the release until you understand the reason.
This is where internal links help readers continue the investigation. If retries are mostly caused by waits, read Selenium to Playwright Migration Part 5: Waits, Retries, and Infrastructure. If your team is comparing modern browser automation options, read Selenium to Playwright Migration Part 1. The point is not to blame Selenium. The point is to make infrastructure evidence visible.
A CI Gate You Can Copy Today
Here is the release gate I recommend for most teams. It is intentionally small. Add more checks later, but do not skip the basics.
Step-by-step gate
- Start or select the release Grid.
- Wait for
/statusto return successfully. - Verify readiness is true.
- Verify node count and slot count match the release baseline.
- Verify browser family and browser version match the release baseline.
- Verify GraphQL
sessionQueueSizeis zero. - Run a 3-test smoke pack.
- Run the full suite only if the smoke pack passes without infrastructure retries.
- Save status, GraphQL summary, logs, and retry report as artifacts.
GitHub Actions example
This example assumes your Selenium Grid is available before the test job starts. Adapt the URL and scripts for Jenkins, GitLab CI, Azure DevOps, or Buildkite.
name: release-tests

on:
  workflow_dispatch:

jobs:
  selenium-release:
    runs-on: ubuntu-latest
    env:
      GRID_URL: http://selenium-grid.internal:4444
      MIN_GRID_NODES: 3
      MIN_GRID_SLOTS: 6
      TEST_WORKERS: 6
    steps:
      - uses: actions/checkout@v4

      - name: Install dependencies
        run: pip install requests

      - name: Check Selenium Grid health
        run: python3 ci/check_grid.py

      - name: Save Grid status
        run: |
          mkdir -p artifacts
          curl -s "$GRID_URL/status" > artifacts/grid-status-before.json

      - name: Run release smoke
        run: pytest tests/smoke --maxfail=1

      - name: Run release regression
        run: pytest tests/regression -n $TEST_WORKERS

      - name: Save Grid status after run
        if: always()
        run: curl -s "$GRID_URL/status" > artifacts/grid-status-after.json
The smoke pack is the key. If the Grid is unhealthy, three tests are enough to detect it. Do not spend 40 minutes proving the same thing with 600 tests.
What to put in the release report
Your release report should include these Grid facts:
- Selenium server version.
- Browser versions used in CI.
- Node count and total slot count.
- Configured test workers.
- Session queue size before the run.
- Retry count and retry categories.
- Links to Grid status and logs as artifacts.
This turns Grid health from tribal knowledge into release evidence.
India QA Team Context
In India, many QA teams still run shared Selenium infrastructure across multiple squads. I see this pattern in service companies and in product teams that grew quickly: one Grid, many pipelines, loose ownership. It works until a release day.
The problem is not the tool. The problem is unclear ownership. One team upgrades browser images. Another team increases parallel workers. A third team adds video recording. Suddenly the Grid is slow, but nobody owns the release risk.
If you are an SDET aiming for senior roles, this is an easy place to stand out. Do not only write tests. Own the release signal. A good Grid health gate shows engineering maturity because it protects developers, testers, and release managers from noisy failures.
What hiring managers notice
For SDET roles in product companies, especially in Bengaluru, Hyderabad, Pune, and remote-first teams, interviewers care about more than Selenium syntax. They ask how you reduce flakiness, design CI gates, debug parallel execution, and prove release readiness. A candidate who can explain Selenium Grid health checks with status APIs, GraphQL, Docker image pinning, and retry classification is stronger than someone who only says, “I know Selenium.”
Practical ownership model
Use this ownership model if your team has no clear Grid owner:
- QA owns the health check script and retry classification.
- DevOps owns CPU, memory, networking, and Kubernetes or Docker runtime.
- Engineering managers own release policy: what blocks release and what does not.
- Developers own real product failures found by the tests.
This avoids the common blame loop. The Grid check creates evidence before the argument starts.
Key Takeaways: Selenium Grid Health Checks Before Release
Selenium Grid health checks are not optional if your release pipeline depends on browser automation. They are the difference between a trusted test signal and a noisy red build.
- Check
/statusbefore the suite starts, not after it fails. - Use GraphQL to capture node count, slot count, Selenium version, active sessions, and queue size.
- Pin Docker images for release pipelines and upgrade them through explicit PRs.
- Match test parallelism to real Grid capacity.
- Classify retries by root cause so Grid noise does not hide product risk.
- Save Grid status, logs, and retry reports as CI artifacts.
If you implement only one thing today, add a pre-run gate that fails when the Grid is not ready, required nodes are missing, or queue size is already non-zero. That one check will save more release time than another generic retry.
FAQ
What is the most important Selenium Grid health check?
Start with GET /status. It tells you whether the Grid is ready and gives details about registered nodes, sessions, and slots. For release CI, combine it with a minimum node and slot check.
Should I fail CI if the Selenium Grid session queue is not empty?
For a release pipeline, yes. A non-zero queue before the run means your suite is already competing for capacity. Daily non-blocking runs can warn instead of fail, but releases need a clean signal.
How often should we upgrade Selenium Grid Docker images?
Use a scheduled upgrade window, not random pulls during release runs. Pin image tags in CI, test upgrades with a small smoke pack, and record Selenium plus browser versions in build artifacts.
Do Selenium Grid health checks remove flaky tests?
No. They remove infrastructure confusion. You still need good waits, stable locators, isolated test data, and clean assertions. Health checks make sure you are debugging the right problem.
Can I use the same checks for Jenkins and GitHub Actions?
Yes. The commands are plain HTTP calls and scripts. Jenkins, GitHub Actions, GitLab CI, Azure DevOps, and Buildkite can all run the same health gate before the browser suite.
🎓 Master Playwright End to End
Join hundreds of SDETs building real automation frameworks. Lifetime access, hands-on projects, and a job-ready portfolio.