Playwright Performance Testing with TypeScript
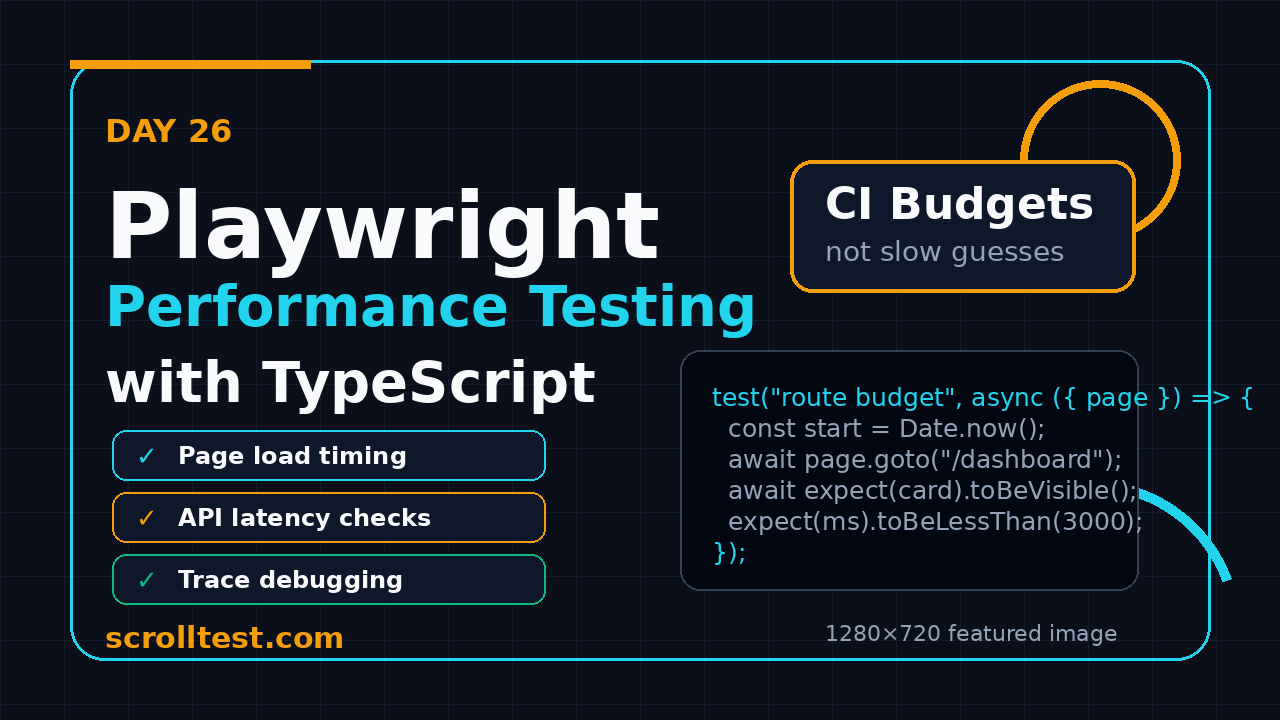
Playwright Performance Testing with TypeScript is not a replacement for k6, JMeter, Gatling, or a full load test. I use it for a different job: catching slow user journeys, heavy pages, late API calls, and obvious performance regressions before they reach staging sign-off.
If you already write Playwright tests, you already have the browser, the test runner, traces, screenshots, network hooks, and CI integration. In this Day 26 tutorial, I show the exact performance checks I add to a TypeScript framework without turning the suite into a fake benchmark lab.
Table of Contents
- Why Performance Tests Belong in Playwright
- What to Measure First
- Project Setup for Performance Checks
- Measuring Page Load with Browser Timing
- Capturing Web Vitals Signals
- Tracking API Timing During a User Flow
- Performance Budgets in CI
- Debugging Regressions with Traces
- Common Pitfalls I See in Teams
- Key Takeaways
- FAQ
Contents
Why Performance Tests Belong in Playwright
I see one mistake in many QA teams: performance testing is treated as a separate event. Someone runs JMeter before a release, shares a PDF, and the automation suite still lets a 9 second checkout page merge into main.
That gap is where Playwright Performance Testing with TypeScript helps. It gives SDETs a lightweight guardrail inside the same test flow that already verifies login, checkout, search, reports, and dashboards.
Use Playwright for regressions, not load claims
Playwright drives a real browser. That makes it useful for front-end timing, network waits, rendering delays, JavaScript errors, heavy routes, and user-perceived slowness. It does not create thousands of virtual users cheaply.
My rule is simple: use Playwright to answer, “Did this user journey become slower than our agreed budget?” Use k6, Gatling, Locust, or JMeter to answer, “Can this system survive 5,000 concurrent users?” Mixing those questions creates bad tests and worse decisions.
Why this matters for QA careers
Product teams in India now expect SDETs to understand more than selectors and assertions. A ₹25 to ₹40 LPA SDET is often asked why a page is slow, which API call is blocking the journey, and whether a regression should block release.
Performance signals inside Playwright help you speak that language. You do not need to become a full-time performance engineer to add useful checks. You need a repeatable method, clean budgets, and enough evidence to start a focused bug.
Current adoption data
Playwright is not a niche tool anymore. The GitHub repository API showed about 92,991 stars and 6,107 forks during this run. The npm downloads API for @playwright/test showed 184,398,283 downloads for the last-month window ending 2026-07-15. I cite these numbers because they explain why Playwright skills now appear in real SDET job descriptions, not only conference talks.
What to Measure First in Playwright Performance Testing with TypeScript
Do not start by measuring everything. Most teams fail because they add 18 metrics, nobody trusts them, and the suite becomes noisy. Start with the signals that map to user pain.
The first four signals
- Navigation time: how long it takes from route open to the app being usable.
- Critical API timing: which backend calls delay the screen.
- Largest visible content: whether the main content appears within the target window.
- Interaction readiness: whether buttons, filters, and search inputs respond quickly.
Google’s Web Vitals documentation defines user-centered metrics such as Largest Contentful Paint, Cumulative Layout Shift, and Interaction to Next Paint. In automation, I treat those metrics as product signals, not vanity scores.
Pick budgets before writing tests
A performance test without a budget is just logging. Before I add a check, I ask the team for one number. For example: dashboard route under 3,000 ms on CI, search API under 1,200 ms, invoice PDF preview under 5,000 ms.
The first version does not have to be perfect. Start with a generous budget, collect data for one week, then tighten it. This avoids a fight on day one and gives the team real numbers.
Screenshot description
Screenshot to capture: CI job summary with one failing performance test. Highlight the route name, measured time, budget, and trace attachment. This is the screenshot a developer can act on in 30 seconds.
A baseline table I like
Before I make any budget blocking, I create a small baseline table. It has route, action, median time, slowest run, owner, and current budget. The owner column is important. If the checkout page is slow, QA should not own the fix alone. The feature team should own the budget with QA providing measurement and evidence.
Here is a practical starting table: dashboard usable under 3,000 ms, search results under 2,500 ms, checkout review under 4,000 ms, report export request under 5,000 ms, and login under 3,500 ms. Your app will differ, but this format creates a clear release conversation.
Project Setup for Performance Checks
I keep performance checks separate from normal functional smoke tests. They run in the same Playwright framework, but the file names, tags, and CI job are different.
Folder structure
tests/
  perf/
    dashboard.perf.spec.ts
    checkout.perf.spec.ts
  e2e/
    login.spec.ts
utils/
  performanceBudget.ts
  webVitals.ts
playwright.config.ts
Install and config basics
npm init playwright@latest
npm install -D @playwright/test typescript
npx playwright install --with-deps chromium
For CI stability, I usually run performance checks in Chromium first. Cross-browser performance checks are useful later, but early noise slows adoption.
Playwright config for performance tests
// playwright.config.ts
import { defineConfig, devices } from '@playwright/test';

export default defineConfig({
  testDir: './tests',
  timeout: 60_000,
  expect: { timeout: 10_000 },
  retries: process.env.CI ? 1 : 0,
  reporter: [['html'], ['list']],
  use: {
    baseURL: process.env.BASE_URL ?? 'https://example.com',
    trace: 'retain-on-failure',
    screenshot: 'only-on-failure',
    video: 'retain-on-failure'
  },
  projects: [
    {
      name: 'chromium-perf',
      testMatch: /.*\.perf\.spec\.ts/,
      use: { ...devices['Desktop Chrome'] }
    }
  ]
});
Notice the trace setting. The official Playwright trace viewer is one of the fastest ways to debug why a test became slow because it shows actions, network, console, screenshots, and timing in one artifact.
Measuring Page Load with Browser Timing
The simplest useful test is a route timing check. It should not use arbitrary sleeps. It should wait for a screen-specific signal that proves the page is usable.
A reusable budget helper
// utils/performanceBudget.ts
import { expect } from '@playwright/test';

export type Budget = {
  name: string;
  actualMs: number;
  budgetMs: number;
};

export async function expectWithinBudget(result: Budget) {
  const message = `${result.name}: ${result.actualMs}ms budget ${result.budgetMs}ms`;
  expect(result.actualMs, message).toBeLessThanOrEqual(result.budgetMs);
}
Dashboard route timing test
// tests/perf/dashboard.perf.spec.ts
import { test, expect } from '@playwright/test';
import { expectWithinBudget } from '../../utils/performanceBudget';

test('dashboard becomes usable within budget', async ({ page }) => {
  const start = Date.now();

  await page.goto('/dashboard');
  await expect(page.getByRole('heading', { name: /dashboard/i })).toBeVisible();
  await expect(page.getByTestId('revenue-card')).toBeVisible();
  await expect(page.getByRole('button', { name: /refresh/i })).toBeEnabled();

  const usableMs = Date.now() - start;

  await test.info().attach('performance-summary', {
    body: JSON.stringify({ route: '/dashboard', usableMs }, null, 2),
    contentType: 'application/json'
  });

  await expectWithinBudget({
    name: 'dashboard usable time',
    actualMs: usableMs,
    budgetMs: 3000
  });
});
This test is intentionally boring. It measures what the user cares about: can I see the dashboard and use the refresh button? Boring tests catch expensive regressions.
Why not networkidle?
I avoid using networkidle as the primary readiness signal for modern apps. Analytics calls, streaming requests, polling, and websockets can make it unreliable. A business-level locator is usually better.
Capturing Web Vitals Signals
Playwright can execute JavaScript in the browser and collect performance entries. This is useful when you want a closer signal for paint timing or layout instability.
// utils/webVitals.ts
import type { Page } from '@playwright/test';

export async function getNavigationTiming(page: Page) {
  return await page.evaluate(() => {
    const nav = performance.getEntriesByType('navigation')[0] as PerformanceNavigationTiming;
    return {
      domContentLoadedMs: Math.round(nav.domContentLoadedEventEnd - nav.startTime),
      loadEventMs: Math.round(nav.loadEventEnd - nav.startTime),
      responseMs: Math.round(nav.responseEnd - nav.requestStart),
      transferSize: nav.transferSize
    };
  });
}
Use it in a test
import { test, expect } from '@playwright/test';
import { getNavigationTiming } from '../../utils/webVitals';

test('orders page navigation timing stays healthy', async ({ page }) => {
  await page.goto('/orders');
  await expect(page.getByRole('heading', { name: /orders/i })).toBeVisible();

  const timing = await getNavigationTiming(page);
  test.info().annotations.push({ type: 'perf', description: JSON.stringify(timing) });

  expect(timing.domContentLoadedMs).toBeLessThanOrEqual(2000);
  expect(timing.loadEventMs).toBeLessThanOrEqual(3500);
});
The official Playwright assertions guide explains how auto-retrying assertions work. That matters here because your readiness check should wait like a user would, not race the page.
Limitations
Lab timing in CI is not the same as field data from real users. CI machines have different CPU, network, cache, and geography. Treat these checks as regression guards. Do not claim they represent every customer.
Tracking API Timing During a User Flow
Many slow pages are not slow because of rendering. They are slow because one backend call blocks the main screen. Playwright lets you record those calls while the browser performs the journey.
Capture response durations
import { test, expect, Response } from '@playwright/test';

test('search results API stays within budget', async ({ page }) => {
  const timings: Array<{ url: string; status: number; durationMs: number }> = [];

  page.on('request', request => {
    (request as any)._startTime = Date.now();
  });

  page.on('response', async (response: Response) => {
    const request = response.request();
    const startTime = (request as any)._startTime;
    if (!startTime) return;

    const url = response.url();
    if (url.includes('/api/search')) {
      timings.push({
        url,
        status: response.status(),
        durationMs: Date.now() - startTime
      });
    }
  });

  await page.goto('/search');
  await page.getByPlaceholder('Search products').fill('iphone');
  await page.getByRole('button', { name: /search/i }).click();
  await expect(page.getByTestId('search-results')).toBeVisible();

  const searchCall = timings.find(item => item.url.includes('/api/search'));
  expect(searchCall, 'search API call should be captured').toBeTruthy();
  expect(searchCall!.status).toBe(200);
  expect(searchCall!.durationMs).toBeLessThanOrEqual(1200);
});
Cleaner pattern with waitForResponse
const [response] = await Promise.all([
  page.waitForResponse(resp =>
    resp.url().includes('/api/search') && resp.request().method() === 'GET'
  ),
  page.getByRole('button', { name: /search/i }).click()
]);

expect(response.status()).toBe(200);
If you only need one API call, waitForResponse is cleaner. If you want a full timing report, event listeners give you better coverage.
Performance Budgets in CI
A performance check becomes useful when it blocks a real regression. But if it blocks every second build because of noisy thresholds, the team disables it. Budget design matters.
Recommended first budgets
- Start with 3 to 5 critical journeys, not 50 screens.
- Use one browser project first, usually Chromium.
- Run each check after deploy to a stable test environment.
- Attach JSON timing data to the Playwright report.
- Review failures weekly and tune budgets only with evidence.
GitHub Actions job
name: Playwright Performance Checks

on:
  workflow_dispatch:
  pull_request:
    branches: [main]

jobs:
  playwright-perf:
    runs-on: ubuntu-latest
    steps:
      - uses: actions/checkout@v4
      - uses: actions/setup-node@v4
        with:
          node-version: 20
      - run: npm ci
      - run: npx playwright install --with-deps chromium
      - run: npx playwright test --project=chromium-perf
        env:
          BASE_URL: ${{ secrets.STAGING_BASE_URL }}
      - uses: actions/upload-artifact@v4
        if: always()
        with:
          name: playwright-perf-report
          path: playwright-report/
If you want a deeper CI walkthrough, read the earlier ScrollTest tutorial on Playwright with GitHub Actions. Pair that with Playwright reports so developers can see evidence without pulling logs from the terminal.
Use soft rollout first
For the first week, I often run these tests in report-only mode. The job stores measurements but does not fail the build. After the team trusts the data, I enable hard budgets for the top three flows.
Report trends, not only failures
A single failed run gets attention, but trends change engineering behavior. Store the JSON attachment from every run in CI artifacts or push the numbers into a simple dashboard. Even a weekly spreadsheet works at the start. If the dashboard page moved from 1,900 ms to 2,700 ms over four releases, you can raise the issue before it becomes a customer complaint.
I prefer a boring report with five columns: date, branch, route, measured time, and budget. That report is enough for a team lead to see whether performance is drifting. You can add percentiles and charts later.
Debugging Regressions with Traces
When a budget fails, the next question is not “who broke it?” The next question is “what changed in the journey?” Playwright traces help because they preserve the browser story.
What to inspect in the trace
- Action timeline: which click or assertion waited too long.
- Network panel: which request blocked the page.
- Console messages: JavaScript errors or warnings during load.
- Screenshots: whether skeleton loaders, modals, or banners delayed readiness.
- DOM snapshots: whether the locator waited for the wrong element.
The official trace viewer documentation explains how traces are opened and inspected. I also covered practical usage in the ScrollTest guide on Playwright Trace Viewer.
Screenshot description
Screenshot to capture: trace viewer timeline showing a slow API response before the dashboard card appears. Add a rectangle around the network request and another around the assertion wait.
Common Pitfalls I See in Teams
Performance tests fail for predictable reasons. Most problems are framework design issues, not Playwright issues.
Pitfall 1: Measuring login every time
If every performance test starts with UI login, your data includes authentication delay, redirects, and token setup. Use stored state for most checks. Keep one separate login performance test if login speed matters.
Pitfall 2: Using fixed sleeps
await page.waitForTimeout(5000) turns a performance test into fiction. It adds artificial time and hides real readiness signals. Use locators, responses, and browser performance entries.
Pitfall 3: Comparing local laptop timing with CI timing
Your MacBook timing and CI timing are different datasets. Do not mix them in one dashboard. Track CI against CI budgets, local against local baselines, and production RUM against production users.
Pitfall 4: Writing one giant test
A 12 step end-to-end flow can tell you the whole journey is slow, but it rarely tells you why. Split the flow into login, search, checkout, report generation, and export. Smaller tests create cleaner bug reports.
Pitfall 5: Ignoring test environment noise
If the test environment restarts randomly, shares a tiny database, or runs nightly jobs during CI, your performance tests will be blamed unfairly. Stabilize the environment or schedule checks when the environment is predictable.
Key Takeaways
Playwright Performance Testing with TypeScript works best as a regression guard inside your existing automation framework. It should be small, boring, budget-driven, and tied to user journeys.
- Use Playwright for browser and journey performance regressions, not load testing.
- Start with 3 to 5 critical routes and one browser in CI.
- Measure usable screens, critical API calls, and browser timing signals.
- Attach JSON summaries, screenshots, and traces to every failure.
- Use budgets that the team agrees to, then tighten them with data.
My recommendation for SDETs is direct: add one performance spec this week. Pick the slowest page your team complains about, add a budget, publish the report, and use the trace to start a better engineering conversation.
FAQ
Can Playwright replace JMeter or k6?
No. Playwright is excellent for real browser journeys and regression checks. JMeter, k6, Gatling, and similar tools are better for load, stress, and high-concurrency scenarios.
Should I run Playwright performance tests on every pull request?
Run a small set on pull requests and a larger set after deployment to staging. If the environment is noisy, start with report-only mode before making the job blocking.
Which metric should I start with?
Start with usable page time for one critical route. It is easy to explain to product managers and developers. Add API timing and Web Vitals-style signals after the first check is trusted.
How many retries should performance tests use?
Use fewer retries than functional tests. One retry in CI is acceptable while the suite matures. If a test needs three retries to pass, the budget or environment is not stable enough.
What should I learn next?
Read the earlier ScrollTest tutorials on Trace Viewer, GitHub Actions CI, and Playwright reporting. Those three skills make performance failures easier to debug and easier to defend in release meetings.