AI Browser Bug Evidence Pack: Trace, Logs, Prompt
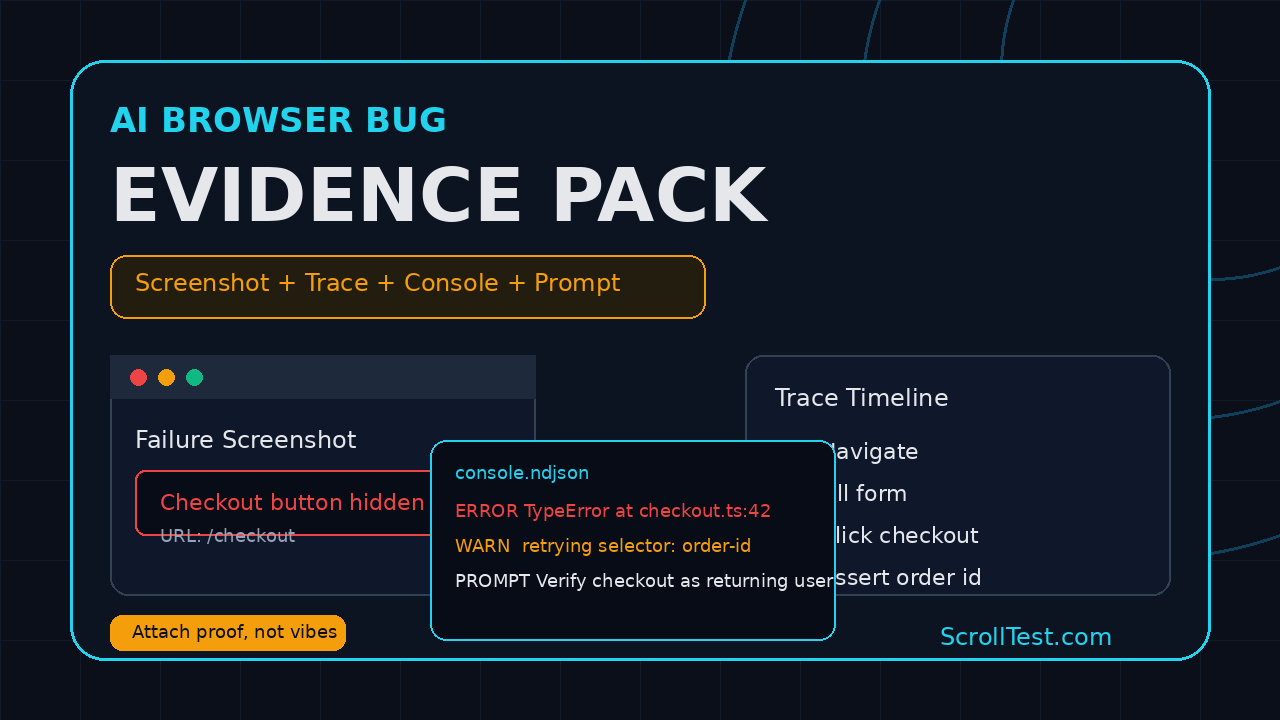
AI browser bug evidence pack is the difference between “the agent failed” and “here is the exact browser state that failed.” If you run AI browser workflows with BrowsingBee, Playwright, Claude, Cursor, or any internal QA agent, every bug report needs the same four assets: screenshot, trace, console output, and the exact agent instruction.
I see teams skip this because the AI run “looked obvious” in the moment. Then the Slack thread grows to 42 messages, the developer cannot reproduce it, and the QA engineer has to rerun the same flow by hand. That is not AI testing. That is manual testing with a more expensive wrapper.
Table of Contents
- What Is an AI Browser Bug Evidence Pack?
- Why AI Browser Bugs Need More Proof
- The Four Files Every Report Needs
- BrowsingBee Evidence Workflow
- Playwright Implementation
- Bug Report Template
- CI and Team Process
- India SDET Career Angle
- Key Takeaways
- FAQ
Contents
What Is an AI Browser Bug Evidence Pack?
An AI browser bug evidence pack is a small bundle attached to every failed AI browser run. It proves what the agent was asked to do, what the browser showed, what JavaScript errors appeared, and what Playwright or the browser automation layer recorded during the run.
The simple definition
Think of it as a reproducibility contract. If I send a bug to a developer, that developer should not ask “what did you click?” or “which page was this?” The answer should already be inside the pack.
A good pack contains:
- Screenshot: the visual state at failure time.
- Trace: the step-by-step browser timeline.
- Console output: JavaScript errors, warnings, and network hints.
- Agent instruction: the exact prompt or BrowsingBee skill command used.
Why this matters for BrowsingBee
BrowsingBee turns a web app workflow into a reusable AI skill. The official BrowsingBee guide says a skill is built from steps such as Navigate, Fill, Click, and Extract, then run from the CLI with a command like browsingbee run sign-in-skill and structured JSON output. Source: BrowsingBee: How BrowsingBee Works.
That is useful because the skill becomes the contract. But a contract without evidence is still weak. If a skill fails on checkout, login, report export, or dashboard extraction, the team needs the exact instruction and the browser artifacts from that run.
What makes AI browser bugs different
Traditional automation failures are usually tied to a test name and a line number. AI browser failures often involve an instruction, model behavior, page state, selector choice, timing, and extraction logic. That adds more moving parts.
For example, “find the latest invoice and download the PDF” may fail because the agent clicked the wrong invoice, because the app showed a toast late, because the table sorted differently, or because the page logged a client-side error. A screenshot alone will not explain all four options.
Why AI Browser Bugs Need More Proof
AI browser bug evidence pack sounds heavy until you compare it with the cost of a weak bug report. One missing trace can waste 30 minutes for QA, 30 minutes for a developer, and another 15 minutes in a manager thread. Multiply that by 10 flaky agent runs in a sprint and the team loses half a day.
AI agents can fail for more reasons than scripts
A normal Playwright test executes a fixed sequence. An AI browser agent may choose steps based on visible text, previous context, tool output, and the prompt. That means the failure is not always in the web app. Sometimes the prompt is vague. Sometimes the agent chooses the wrong target. Sometimes the web page is slow.
The evidence pack keeps the conversation honest. Instead of blaming “AI,” the team can classify the failure:
- Application bug: the app shows an error or wrong state.
- Automation bug: the step or selector is brittle.
- Prompt bug: the instruction is ambiguous.
- Environment bug: test data, auth, network, or feature flags differ.
- Timing bug: the page needs a better wait or a better readiness signal.
The Playwright ecosystem is already evidence-first
This is not a new idea. Playwright has trace viewer, screenshots, videos, reporters, console events, and attachments because browser failures need artifacts. The Playwright Trace Viewer documentation describes traces as a way to explore recorded tests after the script runs, especially for CI failures. The Playwright screenshot documentation shows a one-line API: await page.screenshot({ path: 'screenshot.png' }).
Playwright is not a niche tool anymore. The Microsoft Playwright GitHub repository showed 91,911 stars when I checked the GitHub API on 30 June 2026. The npm API showed 163,181,703 last-month downloads for @playwright/test for the 30 May to 28 June 2026 window. Those numbers are not proof that every team uses traces well, but they do prove the tooling is mainstream.
Weak evidence creates bad engineering habits
When teams accept vague agent failures, they train everyone to treat AI testing as a demo. The agent becomes a toy that can be ignored when it fails. That is the wrong direction.
I want AI browser runs to produce stronger evidence than a manual tester’s screen recording. A manual tester can forget what they typed. A browser agent can save the instruction, trace, screenshot, logs, URL, time, and extracted JSON every single run.
The Four Files Every Report Needs
Do not overcomplicate the first version. Start with four files and one small metadata block. If the evidence pack is easy to attach, engineers will use it. If it needs a 12-step process, it will die in week 2.
1. Screenshot
The screenshot answers the first human question: “What did the browser show?” Capture it at the moment the agent detects failure, not 5 seconds later after the app redirects or recovers.
For AI workflows, I prefer two screenshots:
- Failure screenshot: the exact state where the run stopped.
- Full-page screenshot: a scrollable page capture when layout or missing content matters.
The Playwright screenshot API supports normal and full-page screenshots. If the failure is a visual mismatch, missing CTA, hidden modal, or blank dashboard, the screenshot is often the fastest clue.
2. Trace
The trace is the most important artifact for browser automation. It shows actions, DOM snapshots, network events, console messages, and timings in a timeline. Playwright recommends enabling tracing through Playwright Test configuration because that path includes test assertions; the lower-level context.tracing API captures browser operations and network activity but not test assertions. Source: Playwright Tracing API.
For AI browser bugs, the trace tells you whether the agent clicked the wrong element, waited too little, landed on the wrong page, or saw different content than the test expected.
3. Console output
Console logs are not noise when an AI agent drives a browser. A single TypeError, failed hydration, blocked CORS call, or 401 response can explain why the agent saw the wrong UI. Playwright exposes console messages through page.on('console'); the official API says each console message logged in the page has a corresponding event in the Playwright context. Source: Playwright ConsoleMessage API.
Do not attach every debug log forever. Save errors and warnings by default, and allow full console capture for hard-to-reproduce runs.
4. Exact agent instruction
This is the part most teams forget. If the agent receives “check checkout works,” the bug report must contain that exact instruction. If the agent receives a BrowsingBee command, save the command too:
browsingbee run checkout-smoke --json > artifacts/checkout-smoke/result.jsonThe BrowsingBee quickstart shows the CLI install command npm i -g browsingbee and a run pattern where the user gets structured JSON back from a named skill. Source: BrowsingBee Quickstart. That JSON output belongs inside the evidence pack.
BrowsingBee Evidence Workflow
BrowsingBee’s product idea is simple: define a web workflow once, then let agents run it on demand. That makes it a natural fit for repeatable evidence. The skill name, target URL, step list, command, JSON result, screenshot, and trace can all sit together.
Recommended folder structure
Use one folder per run. Keep the folder name boring and searchable. I prefer this pattern:
artifacts/
  2026-06-30_checkout-smoke_failed/
    instruction.txt
    browsingbee-command.txt
    result.json
    screenshot.png
    trace.zip
    console.ndjson
    metadata.json
The folder name gives you the date, skill, and status. The files answer the questions that developers ask during triage.
What metadata to save
The metadata file should be short. Do not create a data warehouse before you have discipline around basic artifacts.
{
  "skill": "checkout-smoke",
  "status": "failed",
  "startedAt": "2026-06-30T03:30:00Z",
  "baseUrl": "https://staging.example.com",
  "browser": "chromium",
  "viewport": "1280x720",
  "commit": "a1b2c3d",
  "environment": "staging",
  "owner": "qa-platform",
  "failureClass": "unknown"
}
That is enough for week 1. Later you can add build number, feature flag state, tenant ID, test data ID, or CI job URL.
How to classify the failure
Every failed run should end with one of these labels:
app-bugprompt-bugautomation-bugdata-bugenvironment-bugneeds-human-review
This one field changes the team conversation. If 7 out of 10 failures are prompt bugs, do not blame the product team. Fix the prompt or the skill. If 5 out of 10 failures are app bugs, open product defects with the pack attached.
Playwright Implementation
You can implement the same evidence pack in a plain Playwright TypeScript project. If BrowsingBee is your workflow layer, Playwright can still be your artifact engine for screenshots, traces, console logs, and CI reports.
Playwright config for traces and screenshots
Start with configuration. This is the minimum setup I want on any AI browser workflow that touches a real product surface.
// playwright.config.ts
import { defineConfig } from '@playwright/test';

export default defineConfig({
  testDir: './tests',
  timeout: 60_000,
  use: {
    baseURL: process.env.BASE_URL || 'https://staging.example.com',
    trace: 'retain-on-failure',
    screenshot: 'only-on-failure',
    video: 'retain-on-failure',
  },
  reporter: [
    ['html', { outputFolder: 'playwright-report', open: 'never' }],
    ['json', { outputFile: 'artifacts/playwright-results.json' }]
  ]
});
The Playwright reporters documentation lists built-in reporters and shows the --reporter CLI option plus config-based reporter setup. Source: Playwright Test Reporters.
Capture console errors in the test
Here is a small fixture-style pattern you can adapt. It saves console errors and page errors to an NDJSON file. NDJSON is easier to append and parse than one giant JSON array.
// tests/agent-evidence.spec.ts
import { test, expect } from '@playwright/test';
import fs from 'node:fs';
import path from 'node:path';

function writeJsonLine(file: string, value: unknown) {
  fs.mkdirSync(path.dirname(file), { recursive: true });
  fs.appendFileSync(file, JSON.stringify(value) + '\n');
}

test('agent checkout smoke evidence pack', async ({ page }, testInfo) => {
  const runDir = path.join('artifacts', testInfo.title.replace(/\W+/g, '-'));
  const consoleFile = path.join(runDir, 'console.ndjson');

  page.on('console', msg => {
    if (['error', 'warning'].includes(msg.type())) {
      writeJsonLine(consoleFile, {
        type: msg.type(),
        text: msg.text(),
        location: msg.location(),
        time: new Date().toISOString()
      });
    }
  });

  page.on('pageerror', error => {
    writeJsonLine(consoleFile, {
      type: 'pageerror',
      message: error.message,
      stack: error.stack,
      time: new Date().toISOString()
    });
  });

  await page.goto('/checkout');
  await page.getByRole('button', { name: /place order/i }).click();
  await expect(page.getByText(/order confirmed/i)).toBeVisible();
});
Save the agent instruction as an attachment
If the AI agent instruction comes from a prompt file, environment variable, or BrowsingBee wrapper, write it to disk before the browser run begins.
import fs from 'node:fs';
import path from 'node:path';

export function saveAgentInstruction(runDir: string, instruction: string) {
  fs.mkdirSync(runDir, { recursive: true });
  fs.writeFileSync(path.join(runDir, 'instruction.txt'), instruction.trim() + '\n');
}
Small habit, large payoff. When someone changes the prompt from “verify checkout” to “try to complete checkout as a returning user,” you can prove the instruction changed.
Bug Report Template
A good AI browser bug report should fit inside one Jira ticket, Linear issue, GitHub issue, or Slack post. The evidence files can be attached, but the summary must be readable without opening 6 tabs.
Copy-paste template
## Summary
AI browser run failed during: [skill or flow name]

## Exact instruction
[Paste the full prompt, BrowsingBee skill command, or agent task]

## Expected result
[What should the user or agent see?]

## Actual result
[What happened instead?]

## Evidence pack
- Screenshot: [link]
- Trace: [link]
- Console logs: [link]
- Agent result JSON: [link]
- CI run: [link]

## Failure classification
app-bug | prompt-bug | automation-bug | data-bug | environment-bug | needs-human-review

## Reproduction command
```bash
browsingbee run [skill-name] --json
```

## Notes
[One or two facts only. No story.]
What not to write
These bug reports waste time:
- “AI failed on login.”
- “It worked yesterday.”
- “Please check screenshot.”
- “Agent is flaky.”
- “Maybe selector issue.”
Replace opinions with artifacts. If you think it is a selector issue, the trace should show the wrong click or failed locator. If you think it is an app bug, the console or network output should support that claim.
How this connects to existing testing practice
This is the same discipline I recommend for standard automation. ScrollTest already has practical pieces on AI Testing Evidence Pack: Trace, Screenshot, Logs, HAR Recording and Replay in Playwright, and Playwright Upgrade Checklist for Production E2E. The AI browser bug version adds one missing artifact: the exact agent instruction.
CI and Team Process
The evidence pack should not depend on one senior SDET remembering the right commands. Put it in CI, add naming rules, and make it part of the definition of done for AI browser workflows.
CI command pattern
Here is a basic CI command sequence. It creates an artifact directory, saves the instruction, runs the browser job, and uploads the result.
export RUN_ID="$(date -u +%Y%m%dT%H%M%SZ)-checkout-smoke"
mkdir -p "artifacts/$RUN_ID"

printf '%s\n' "Verify checkout for a returning user and confirm the order ID is visible." \
  > "artifacts/$RUN_ID/instruction.txt"

npx playwright test tests/agent-evidence.spec.ts \
  --config=playwright.config.ts \
  --output="artifacts/$RUN_ID/playwright-output"

zip -r "artifacts/$RUN_ID.zip" "artifacts/$RUN_ID" playwright-report
GitHub Actions, GitLab CI, Jenkins, and Azure Pipelines can all upload a zip artifact. The tool does not matter. The habit matters.
Minimum acceptance criteria
For any AI browser bug that goes to engineering, I would set this bar:
- Screenshot exists and matches the reported failure.
- Trace opens in Playwright Trace Viewer or the team’s chosen viewer.
- Console file includes errors and warnings from the run.
- Instruction file contains the exact agent prompt or BrowsingBee command.
- Report has a failure classification.
If one of these is missing, the ticket should stay in QA review unless production is down. This is not bureaucracy. This is how you keep AI testing credible.
How managers should measure this
Do not start with “AI found 50 bugs.” Start with better metrics:
- Percentage of failed agent runs with complete evidence packs.
- Median triage time for AI browser bugs.
- Number of failures classified as prompt bugs versus app bugs.
- Repeat failures for the same skill in 7 days.
- Number of bugs closed as not reproducible.
If “not reproducible” drops from 8 tickets to 2 tickets in a month, the pack is working. If prompt bugs dominate, your next sprint should improve skills and prompts instead of adding more agents.
India SDET Career Angle
For QA engineers in India, this skill is career-relevant. Companies are not paying ₹25-40 LPA for someone who only says “AI can test.” They pay for engineers who can turn AI runs into repeatable signals, CI artifacts, clean reports, and lower triage time.
What hiring managers notice
In interviews, many candidates can talk about Playwright, Selenium, Cypress, or AI tools. Fewer candidates can explain how they debug browser automation failures with trace files, console logs, HAR files, and screenshots. Even fewer can explain how prompt quality changes agent behavior.
If I interview an SDET and they show me a folder with trace.zip, console.ndjson, instruction.txt, and a clean issue template, I immediately know they have run real systems. That is different from watching a 12-minute YouTube demo and repeating buzzwords.
A 7-day practice plan
Use this plan if you want to build the skill this week:
- Day 1: Run one Playwright test with screenshot on failure.
- Day 2: Enable trace retain-on-failure and open the trace viewer.
- Day 3: Capture console errors with
page.on('console'). - Day 4: Save the instruction that triggered the test.
- Day 5: Create the issue template and attach artifacts.
- Day 6: Add the run to CI and upload the artifact zip.
- Day 7: Classify 10 failures and find the top pattern.
This is a better portfolio project than another login test. Build a tiny demo app, break it in 3 ways, and show the evidence pack for each failure.
Key Takeaways
The AI browser bug evidence pack is not optional if you want AI testing to survive outside demos. It is the proof layer that makes agent runs useful for developers, managers, and QA teams.
- Every AI browser bug should include screenshot, trace, console output, and exact agent instruction.
- BrowsingBee skills already give you a clean workflow contract; attach artifacts to make that contract debuggable.
- Playwright’s trace viewer, screenshot API, console events, and reporters give you most of the evidence layer today.
- Classify failures as app, prompt, automation, data, environment, or human-review issues.
- For SDETs, this is a practical skill that separates real AI testing from demo content.
My opinion is simple: if an AI agent cannot produce evidence, do not trust its bug report. Start with the four-file pack. Make it boring. Make it automatic. Then scale it across your browser workflows.
FAQ
What is an AI browser bug evidence pack?
It is a bundle of artifacts attached to a failed AI browser run. The minimum pack includes a screenshot, Playwright trace or browser trace, console output, and the exact instruction or command given to the agent.
Do I need BrowsingBee to use this workflow?
No. You can build the evidence pack with plain Playwright, Selenium, Cypress, or a custom browser agent. BrowsingBee makes the workflow easier to reason about because each skill is a named browser flow with structured output.
Should I attach videos too?
Use video for complex flows, animation bugs, drag-and-drop, and visual timing issues. For most CI bugs, screenshot plus trace plus console output is enough. Video is useful, but trace usually gives stronger debugging detail.
How many logs should I save?
Save console errors and warnings by default. For high-value flows such as checkout, payment, signup, or report export, also save network summaries and the structured JSON result from the agent run.
What is the biggest mistake teams make?
They save a screenshot but lose the instruction. With AI browser agents, the exact instruction is part of the test input. If you cannot show what the agent was asked to do, you cannot debug the run properly.