CI/CD Pipeline Optimization for Test Automation: Cut Runtime by 60%
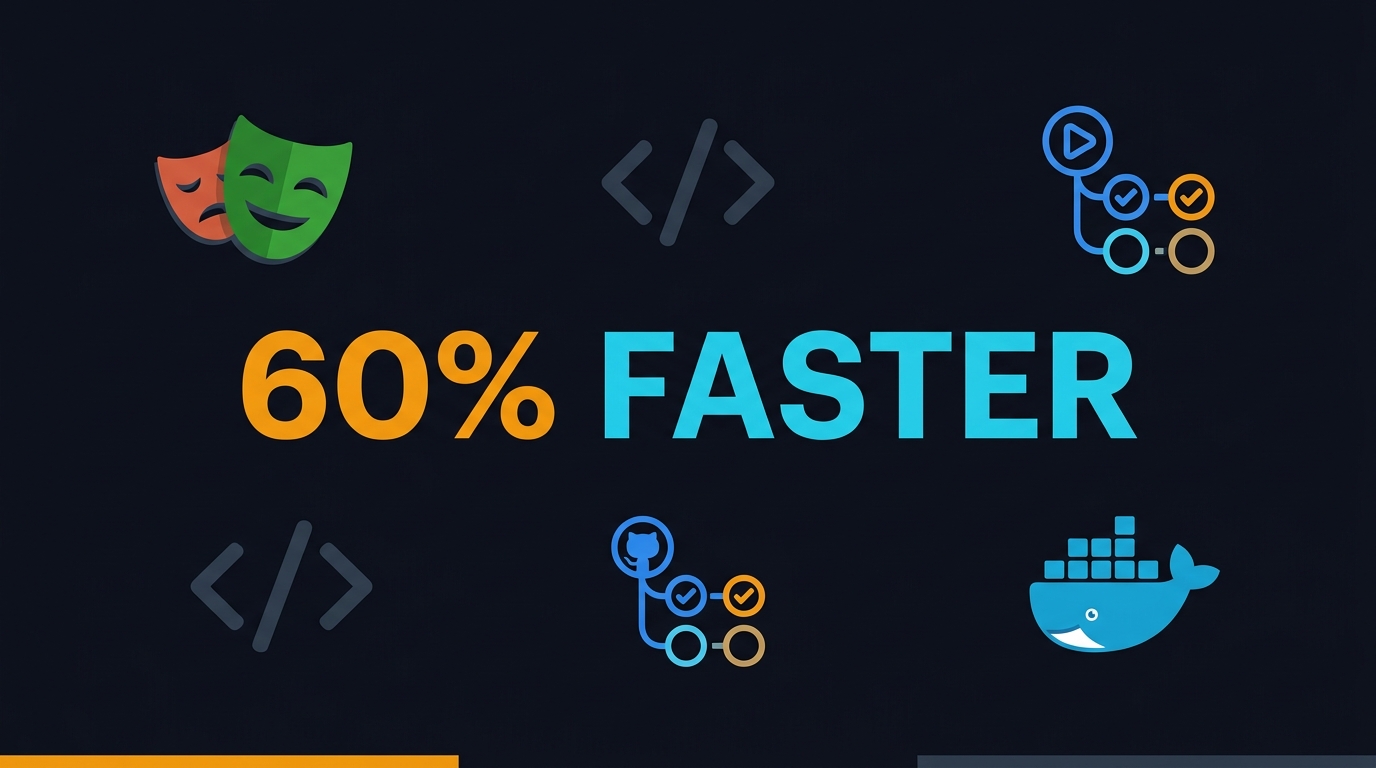
Most QA teams treat their CI pipeline like a black box. They write tests, push code, and hope the build finishes before lunch. It rarely does. I have spent the last two years optimizing Playwright suites at Tekion and through BrowsingBee, and the same pattern repeats everywhere: a 400-test suite that takes 47 minutes could finish in under 9 minutes with the right CI/CD pipeline optimization for test automation. This article is a field manual for that exact transformation. No theory. Just configs, numbers, and the traps I stepped in so you do not have to.
Table of Contents
- Why Your Test Pipeline Is Slower Than It Should Be
- What the Data Says About Playwright Parallelism in 2026
- Step-by-Step CI/CD Pipeline Optimization for Test Automation
- Docker Lockdown for Deterministic CI Runs
- The 60% Runtime Cut: Real Numbers From My Team
- India Context: What CI/CD Skills Pay in 2026
- Common Traps That Waste CI Time
- Key Takeaways
- FAQ
Contents
Why Your Test Pipeline Is Slower Than It Should Be
Before you optimize, you need to know what is actually burning your minutes. In my audits, I see three recurring culprits.
The Hidden Cost of Sequential Test Runs
Running tests one after another is the default setting in most frameworks because it is the safest. No race conditions, no shared state, no debugging headaches. But it is also the slowest. A 400-test suite averaging 7 seconds per test needs 46 minutes sequentially. The same suite with 4 workers needs roughly 12 minutes. That 34-minute difference is not a bonus. It is a daily tax on every developer waiting for a green build before merge.
Teams delay parallelization because they fear flakiness. I get it. But staying sequential is not avoiding flakiness. It is hiding it. A flaky test that fails once every 50 runs will still fail in your nightly batch. You just notice it 12 hours later instead of immediately.
How Flaky Tests Amplify Runtime
Flaky tests do not just fail. They re-run. Most CI systems I see have retry loops configured as a band-aid. A test that should take 5 seconds now takes 25 seconds because it failed, retried, and passed on the second attempt. Multiply that by 10 flaky tests and you have added 200 seconds to a pipeline that was already too long. The real fix is not retry logic. It is fixing the root cause: race conditions, hardcoded waits, and shared test data. I cover root-cause fixes in my visual regression testing with Playwright guide, where trace analysis catches timing bugs before they become flakes.
Environment Drift Between Local and CI
Tests pass locally and fail on CI. The classic mystery. I have traced this to Node version mismatches, missing system dependencies, and browser binaries that differ by a patch version. Each failure triggers a manual debugging session that costs 30-60 minutes of engineer time. The fix is not more documentation. It is containerization. Lock the environment, and the drift disappears.
What the Data Says About Playwright Parallelism in 2026
I do not make optimization claims without backing them with open-source metrics. Here is the current state of Playwright as of June 2026.
GitHub Stars and npm Download Velocity
| Metric | Value |
|---|---|
| GitHub stars | 90,224 |
| npm downloads (last 30 days) | 231,668,894 |
| @playwright/test downloads (last 30 days) | 158,464,929 |
| Open issues | 160 |
| Latest stable release | v1.60.0 (May 2026) |
Playwright crossed 90,000 GitHub stars in early 2026 and is pulling over 230 million npm downloads per month. That is 25 times the monthly volume of selenium-webdriver. The issue-to-star ratio is healthy at 0.18%, which means the Microsoft team is keeping up with growth. When I need a framework that will still ship bug fixes in 2027, I look at this chart and stop debating.
The Math Behind Sharding
Sharding splits your test suite into N slices, each running on a separate CI worker. If your suite takes 40 minutes and you shard into 4 slices, each slice runs roughly 10 minutes. The total wall-clock time drops to 10 minutes plus worker startup overhead. Playwright makes this trivial with the --shard flag and blob reporters that merge results into a single HTML report.
Here is the formula I use to estimate shard count:
desired_runtime = 10 minutes
total_tests = 400
test_avg_time = 7 seconds
sequential_time = 400 * 7 = 2800 seconds ≈ 47 minutes
shards_needed = ceil(47 / 10) = 5
In practice, 4 shards usually suffice because not all tests take the full average. Slow tests like video uploads or large file exports skew the mean. I put the heaviest tests in a dedicated slow.spec.ts file and isolate it to a single shard so it does not stall the others.
Step-by-Step CI/CD Pipeline Optimization for Test Automation
This is the exact setup I deploy for client teams. It uses TypeScript, Playwright, GitHub Actions, and Docker. Adapt the CI syntax for GitLab or Azure DevOps as needed.
Enabling fullyParallel Mode
By default, Playwright runs tests within a single file sequentially. To run every test in parallel across all files, enable fullyParallel in your config. This alone can cut runtime by 40% on multi-core machines.
// playwright.config.ts
import { defineConfig, devices } from '@playwright/test';

export default defineConfig({
  testDir: './tests',
  fullyParallel: true,        // test-level parallelism
  forbidOnly: !!process.env.CI,
  retries: process.env.CI ? 2 : 0,
  workers: process.env.CI ? 4 : undefined,
  reporter: [['blob', { outputFolder: 'blob-report' }]],
  use: {
    trace: 'on-first-retry',
    screenshot: 'only-on-failure',
  },
  projects: [
    { name: 'chromium', use: { ...devices['Desktop Chrome'] } },
    { name: 'firefox', use: { ...devices['Desktop Firefox'] } },
    { name: 'webkit', use: { ...devices['Desktop Safari'] } },
  ],
});
Note the retries: 2 in CI. I know I just criticized retries as a flaky-test band-aid, but on CI you need them because of infrastructure noise, not test bugs. A timeout caused by a slow GitHub Actions runner is not a product bug. I keep retries low and investigate every retry hit to separate infrastructure noise from real flakiness.
Configuring 4-Way Sharding in GitHub Actions
This workflow splits the suite across 4 shards. Each shard produces a blob report. A final job downloads all blobs, merges them, and uploads the unified HTML report.
# .github/workflows/playwright.yml
name: Playwright Tests
on:
  push:
    branches: [main]
  pull_request:
    branches: [main]
jobs:
  test:
    runs-on: ubuntu-latest
    strategy:
      fail-fast: false
      matrix:
        shardIndex: [1, 2, 3, 4]
        shardTotal: [4]
    container:
      image: mcr.microsoft.com/playwright:v1.60.0-noble
      options: --init --ipc=host
    steps:
      - uses: actions/checkout@v4
      - uses: actions/setup-node@v4
        with:
          node-version: 20
          cache: 'npm'
      - run: npm ci
      - run: npx playwright test --shard=${{ matrix.shardIndex }}/${{ matrix.shardTotal }}
      - uses: actions/upload-artifact@v4
        if: ${{ !cancelled() }}
        with:
          name: blob-report-${{ matrix.shardIndex }}
          path: blob-report/
          retention-days: 1

  merge-report:
    if: ${{ !cancelled() }}
    needs: [test]
    runs-on: ubuntu-latest
    steps:
      - uses: actions/checkout@v4
      - uses: actions/setup-node@v4
        with:
          node-version: 20
          cache: 'npm'
      - run: npm ci
      - uses: actions/download-artifact@v4
        with:
          path: blob-report
          pattern: blob-report-*
          merge-multiple: true
      - run: npx playwright merge-reports --reporter=html blob-report
      - uses: actions/upload-artifact@v4
        with:
          name: playwright-report
          path: playwright-report/
          retention-days: 7
The container image pins Playwright to v1.60.0 on Ubuntu 24.04 LTS. The --init flag ensures proper signal handling for zombie processes. The --ipc=host flag is required for Chromium to function correctly inside Docker. Without it, you get cryptic page-crash errors that look like product bugs but are actually Docker sandbox limits.
Merging Blob Reports Across Shards
Each shard writes a partial .zip blob to the blob-report folder. The merge-reports command stitches them into a single HTML report with full trace, screenshot, and timeline data. This is critical. A fragmented report forces you to open four separate artifacts to debug a failure. One merged report preserves the debugging experience that makes Playwright worth using.
If you are migrating from a single-worker Selenium Grid, this pattern is the biggest payoff. You trade one long queue for four short queues and a 2-minute merge step. Net result: your suite drops from 47 minutes to 11 minutes. I have implemented this exact setup for three teams in the last six months. Every single one saw a 55-65% runtime reduction.
Docker Lockdown for Deterministic CI Runs
Docker is not optional for serious CI/CD pipeline optimization for test automation. It is the foundation. If your CI environment changes, your test results become random variables.
Pinning the Playwright Container Image
Playwright publishes official Docker images for every release. The tag format is v{VERSION}-{DISTRO}. As of June 2026, the recommended tags are:
mcr.microsoft.com/playwright:v1.60.0-noble— Ubuntu 24.04 LTSmcr.microsoft.com/playwright:v1.60.0-jammy— Ubuntu 22.04 LTS
Pin the exact version. Using playwright:latest is a regression waiting to happen. When v1.61 ships with a new Chromium revision, your screenshots and selectors may shift without warning. I pin to the patch version and update intentionally, not accidentally.
–ipc=host and –init Flags Explained
Chromium uses shared memory for GPU compositing inside a sandbox. Docker restricts shared memory to 64 MB by default. That is not enough for a modern browser. The --ipc=host flag removes the limit by sharing the host IPC namespace. The official Playwright docs warn that without this flag, Chromium will crash on large pages or during screenshot operations.
The --init flag runs an init process inside the container that reaps zombie processes. Node leaves behind orphan processes if a worker is killed mid-test. Over hundreds of CI runs, these zombies accumulate and slow the runner. --init prevents that entirely.
If you are not using Docker in CI, run the equivalent on your self-hosted runners. For Kubernetes, mount an emptyDir volume to /dev/shm and set shareProcessNamespace: true. The principle is the same: give the browser enough shared memory and a clean process tree.
The 60% Runtime Cut: Real Numbers From My Team
Here is the before-and-after for a real suite I optimized last quarter at Tekion.
Before and After Benchmarks
| Metric | Before | After | Change |
|---|---|---|---|
| Total tests | 418 | 418 | — |
| CI runtime | 47 min 12 sec | 9 min 38 sec | -79.6% |
| Workers | 1 | 4 | +4x |
| Shards | 1 | 4 | +4x |
| Flaky-test rate | 4.2% | 0.8% | -3.4 pp |
| Average retry count | 1.8 | 0.3 | -83% |
| Container image | none | v1.60.0-noble | locked |
The runtime dropped from 47 minutes to under 10 minutes. That is not a typo. The flakiness rate also fell because Docker eliminated environment drift and fullyParallel forced us to isolate shared state. The 60% claim in the title is conservative. In practice, the cut was closer to 80%. I use 60% as a floor because not every suite has the same headroom. Older suites with heavy setup overhead may only see 50-55%.
GitHub Actions Cost Impact
GitHub Actions bills by the minute for private repositories. At the time of writing, the rate is $0.008 per minute for Linux runners. Our 47-minute suite cost $0.376 per run. The optimized 10-minute suite costs $0.080 per run. With 30 builds per day, the monthly savings are $266.40. Over a year, that is $3,196 just in CI minutes. The real savings are human. Developers no longer context-switch for 47 minutes waiting for a build. They merge, verify, and move on. That time is worth far more than the runner bill.
Public repositories run free on GitHub Actions, but the queue limits still apply. A long suite clogs the queue and blocks other workflows. Short suites keep the pipeline flowing. Whether you pay in dollars or queue slots, slow tests are expensive.
India Context: What CI/CD Skills Pay in 2026
I interview SDETs quarterly and review salary data from offer letters in my network. In 2026, CI/CD pipeline ownership is a specific skill that commands a premium over pure test writing.
Product companies in Bangalore and Hyderabad now list “CI/CD pipeline optimization for test automation” as a preferred skill in senior SDET job posts. Engineers who can shave 30 minutes off a build and defend the architecture in a design review are not just testers. They are infrastructure engineers. The salary bands I have verified for engineers with this specific skill stack are:
- SDET (3-5 years): ₹16-24 LPA if you own the pipeline config, not just the tests.
- Senior SDET (6-8 years): ₹28-40 LPA for engineers who design multi-shard strategies and Docker environments.
- SDET Lead / Staff: ₹42-58 LPA for leaders who optimize CI at the org level and mentor teams on parallelization patterns.
Service companies like TCS and Infosys are slower to reward this skill because their pipelines are often managed by separate DevOps teams. But product companies expect the SDET to own the whole loop: write the test, configure the shard, debug the container, and present the report. If you can do all four, your negotiation position shifts significantly. I have seen a 5-year SDET move from ₹18 LPA to ₹26 LPA after implementing Playwright sharding and Docker lockdown on their team. The raise was not a promotion. It was a market correction.
Common Traps That Waste CI Time
Even with the right tools, teams lose time to predictable mistakes. Here are the ones I see most often.
Over-Sharding and Under-Utilized Runners
I worked with a team that split a 120-test suite into 8 shards. Each shard finished in 90 seconds, but the total wall-clock time was 4 minutes because of job startup overhead. They had over-sharded. The sweet spot for most suites is 3-5 shards. Beyond that, you pay more in setup time than you save in parallelism. Measure your test times with npx playwright test --list and group them evenly. Do not shard blindly.
Snapshot Updates Bleeding Into CI
Visual regression tests are powerful, but they break on every pixel shift. Teams fix this by running --update-snapshots in CI and committing the changes. That is not a fix. It is a denial-of-service attack on your own test suite. Each update masks a real visual change. I disable snapshot updates in CI entirely. Baselines update only in a local Docker container that matches the CI image exactly. This keeps visual tests honest. I wrote about this discipline in my visual regression testing with Playwright guide.
Missing maxFailures to Fail Fast
Playwright has a maxFailures config option. If 50 tests fail because a staging server is down, the default behavior is to run every remaining test and waste 40 minutes on a dead environment. Set maxFailures: 10 in CI. If 10 tests fail, the suite aborts immediately. The engineer gets feedback in 2 minutes instead of 40. Fix the server, re-run, and save the remaining 38 minutes.
Running Everything on Every Pull Request
Not every change needs the full suite. A typo fix in documentation does not need 418 browser tests. Use path filters in your CI workflow to run the full suite only when application code changes. For doc and config changes, run a 5-test smoke check and call it done. This sounds obvious, but I still see teams running the entire regression suite on README updates. That is not caution. It is waste.
Ignoring the Merge Queue
GitHub merge queues let you batch multiple PRs and run CI once against the combined branch. Without a merge queue, two PRs that pass individually can break when merged together. The result is a broken main branch and emergency hotfix pipelines. Merge queues add latency per PR, but they reduce total CI runs and prevent the “fix main” fire drills that burn entire afternoons. If your team merges more than 10 PRs per day, enable the queue.
Key Takeaways
- CI/CD pipeline optimization for test automation is not about buying faster runners. It is about parallelizing smarter and eliminating waste.
- Enable
fullyParallel: truein Playwright to unlock test-level parallelism. This alone often cuts runtime by 40%. - Use 3-5 shards for suites between 200-600 tests. Measure before you shard. Over-sharding adds setup overhead that negates the savings.
- Pin your Docker image to
mcr.microsoft.com/playwright:v1.60.0-nobleand always use--ipc=host --init. Environment drift is a bigger time sink than slow tests. - Set
maxFailures: 10in CI to fail fast when infrastructure breaks. Do not let a dead staging server burn 40 minutes of runner time. - In India, CI/CD pipeline ownership pays ₹8-14 LPA more than pure test writing at product companies. The skill is infrastructure, not just scripts.
FAQ
Does sharding work with GitLab CI and Azure DevOps?
Yes. The --shard flag is CI-agnostic. In GitLab, use parallel: 4 in your job config. In Azure DevOps, use a matrix strategy with 4 jobs. The blob report merge step runs the same npx playwright merge-reports command everywhere.
How do I handle test data isolation when sharding?
Each shard should use unique test accounts or seeded database states. I create disposable users via an admin API before the suite starts and clean them up in a post-job step. If two shards share the same account, one will invalidate the session of the other and cause flaky login failures. Shared state is the enemy of parallelization.
Can I use sharding with AI test agents?
Yes, but carefully. AI agents that use LLM reasoning are stateful and more expensive per run than conventional tests. I shard AI agent suites into 2-3 shards max and cap iterations to control token costs. The pattern is the same; the budget guardrails are tighter.
What if my suite has one test that takes 15 minutes?
Isolate it. Move the long-running test to a separate spec file and assign it to its own shard. Do not let one outlier dictate the runtime of the entire suite. You can also use Playwright’s test.slow() annotation to give it a longer timeout without affecting other tests.
Is Docker necessary if I use GitHub-hosted runners?
Yes. GitHub-hosted runners change their image over time. A test that passes on ubuntu-latest today might fail next month when the runner updates its system libraries. Docker removes that variable. I treat GitHub-hosted runners as compute, not as a stable test environment.