Playwright Debugging TypeScript: Day 31 Guide
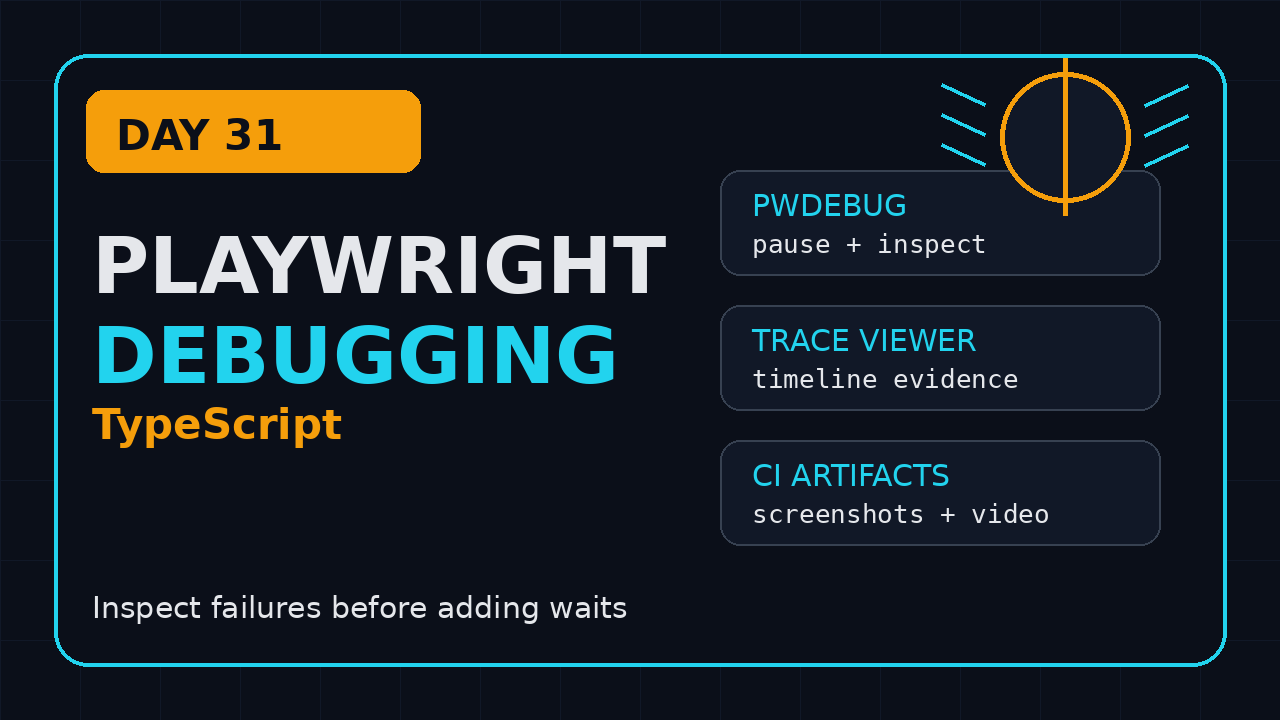
Playwright debugging TypeScript is the skill that separates a person who can record a test from an SDET who can own a regression suite. Day 31 is about finding the real failure fast: locator issue, timing issue, product bug, test data problem, network problem, or CI environment gap.
I see teams spend 30 minutes staring at a red CI job when the trace would have answered the question in 90 seconds. This guide gives you a practical debugging routine for Playwright with TypeScript, not a random list of commands.
Table of Contents
- Why Playwright Debugging Matters
- Set Up a Debuggable Playwright Project
- The Local Playwright Debugging TypeScript Loop
- Trace Viewer Workflow for Real Failures
- Debugging Playwright Failures in CI
- Common Debugging Pitfalls
- India Career Context for SDETs
- Key Takeaways
- FAQ
Contents
Why Playwright Debugging Matters
Debugging is not a side skill. It is the daily job. A test suite with 600 passing tests and 20 unclear failures still blocks releases because nobody trusts the signal.
Playwright gives you strong tools: auto-waiting, web-first assertions, UI Mode, Inspector, trace viewer, screenshots, videos, console logs, network logs, and browser contexts. The problem is not tool availability. The problem is using them in the right order.
For context, the official Playwright debugging documentation covers Inspector, headed mode, UI Mode, and VS Code debugging. The trace viewer documentation explains how to inspect actions, DOM snapshots, network calls, console output, screenshots, and source lines. These are not optional features for a serious framework.
My debugging rule
When a Playwright test fails, I do not immediately add a timeout. I first classify the failure. That one habit prevents most flaky-test patches from becoming permanent technical debt.
- Locator failure: the selector no longer points to the intended element.
- Assertion failure: the expected business state is not visible.
- Timing failure: the test checks before the app finishes the user-visible change.
- Test data failure: the account, order, cart, role, or seed state is wrong.
- Environment failure: CI has different flags, network, permissions, or browser dependencies.
- Product bug: the app behavior is genuinely broken.
The numbers tell us this stack is mainstream
The npm downloads API reported 187,941,781 downloads for @playwright/test between 2026-06-22 and 2026-07-21. The npm registry currently lists @playwright/test version 1.61.1. The GitHub API showed 93,286 stars for microsoft/playwright during my research run.
I include these numbers for one reason: this is not a niche debugging workflow. If you work in automation in 2026, Playwright failures are part of normal engineering life.
Set Up a Debuggable Playwright Project
A debuggable project starts before the first failure. Your configuration should collect enough evidence when CI fails, but not produce so much noise that nobody opens the report.
Install and verify the project
Use TypeScript from day one. It catches simple mistakes before runtime and makes page objects easier to refactor.
npm init playwright@latest
npm install -D @playwright/test typescript
npx playwright --version
npx playwright test --list
For this tutorial, assume this folder structure:
tests/
  checkout.spec.ts
pages/
  checkout-page.ts
playwright.config.ts
package.json
Use a config that records evidence
Here is the baseline config I prefer for teams. It keeps local runs fast and gives CI enough artifacts to debug a failure without rerunning five times.
import { defineConfig, devices } from '@playwright/test';

export default defineConfig({
  testDir: './tests',
  timeout: 30_000,
  expect: { timeout: 7_000 },
  retries: process.env.CI ? 2 : 0,
  workers: process.env.CI ? 2 : undefined,
  reporter: [
    ['html', { open: 'never' }],
    ['list']
  ],
  use: {
    baseURL: process.env.BASE_URL ?? 'https://demo.playwright.dev/todomvc',
    trace: process.env.CI ? 'retain-on-failure' : 'on-first-retry',
    screenshot: 'only-on-failure',
    video: process.env.CI ? 'retain-on-failure' : 'off',
    actionTimeout: 10_000,
    navigationTimeout: 15_000
  },
  projects: [
    { name: 'chromium', use: { ...devices['Desktop Chrome'] } },
    { name: 'firefox', use: { ...devices['Desktop Firefox'] } },
    { name: 'webkit', use: { ...devices['Desktop Safari'] } }
  ]
});
Notice the values. I do not use a 120-second test timeout to hide slow behavior. I use enough time for normal app behavior and enough evidence to explain abnormal behavior.
Connect this with earlier series lessons
If you are joining late, read the ScrollTest guide on Playwright codegen with TypeScript first. Codegen is fine for a draft, but debugging teaches you which generated lines deserve to stay.
Also revisit Debugging Playwright with PWDEBUG and the Inspector if you want a shorter reference on the Inspector itself. Today we go broader and connect local debugging with CI triage.
The Local Playwright Debugging TypeScript Loop
Local debugging has one goal: reproduce the issue in the smallest possible run. Do not start with the entire regression suite. Start with one spec, one project, one headed browser, and one hypothesis.
Step-by-step local workflow
- Copy the exact failing test title from the report.
- Run only that test with
-gor a file path. - Run one browser project first, usually Chromium.
- Switch to headed mode when the failure is visual or timing-related.
- Use Inspector or UI Mode to pause and inspect locators.
- Open the trace only after you have a reproducible failure or a retained retry artifact.
# Run one file
npx playwright test tests/checkout.spec.ts --project=chromium

# Run one test by title
npx playwright test -g "guest can complete checkout" --project=chromium

# Run headed when visual state matters
npx playwright test tests/checkout.spec.ts --headed --project=chromium

# Open UI Mode
npx playwright test --ui

# Use Inspector
PWDEBUG=1 npx playwright test tests/checkout.spec.ts --project=chromium
On Windows PowerShell, use this form:
$env:PWDEBUG=1
npx playwright test tests/checkout.spec.ts --project=chromium
A failing test we can improve
Here is a deliberately average test. It looks normal in many codebases, but it is hard to debug because it mixes action, state, and weak assumptions.
import { test, expect } from '@playwright/test';

test('guest can complete checkout', async ({ page }) => {
  await page.goto('/checkout');
  await page.locator('.name').fill('Dev Tester');
  await page.locator('.email').fill('dev@example.com');
  await page.locator('button').click();
  await expect(page.locator('.success')).toContainText('Order confirmed');
});
When this fails, what broke? The page? The selector? The button click? The submit API? The success message? The browser console? The test data? You cannot tell quickly.
Make the test easier to debug
Now I add stronger locators, a named step structure, and assertions that match the user journey.
import { test, expect } from '@playwright/test';

test('guest can complete checkout', async ({ page }) => {
  await test.step('Open checkout page', async () => {
    await page.goto('/checkout');
    await expect(page.getByRole('heading', { name: 'Checkout' })).toBeVisible();
  });

  await test.step('Enter guest details', async () => {
    await page.getByLabel('Full name').fill('Dev Tester');
    await page.getByLabel('Email').fill('dev@example.com');
  });

  await test.step('Submit order', async () => {
    await page.getByRole('button', { name: 'Place order' }).click();
  });

  await test.step('Verify confirmation', async () => {
    await expect(page.getByRole('status')).toContainText('Order confirmed');
  });
});
The trace viewer now shows readable step names. The HTML report becomes easier for a developer to scan. The locator error also tells the team which user-facing label disappeared.
Screenshot descriptions to capture
When you create tutorial notes or bug reports, include screenshot descriptions like these:
- Screenshot 1: UI Mode test list with only
checkout.spec.tsselected and Chromium active. - Screenshot 2: Inspector paused before the
Place orderclick with the role locator highlighted. - Screenshot 3: HTML report showing the failed
Verify confirmationstep and attached screenshot.
Trace Viewer Workflow for Real Failures
The trace viewer is where Playwright debugging TypeScript becomes practical for teams. It gives you a timeline instead of a vague failure line.
Record and open a trace
For local debugging, I usually force trace on for one run:
npx playwright test tests/checkout.spec.ts --project=chromium --trace on
npx playwright show-trace test-results/**/trace.zip
For CI, I prefer retain-on-failure because always-on traces can become expensive in large suites. The official docs explain the trace options in the Playwright test configuration guide.
Read the trace in this order
Do not randomly click around. Use the same sequence every time:
- Actions: Find the failed action or failed assertion.
- Before snapshot: Check what the page looked like before the action.
- After snapshot: Check whether the expected state appeared.
- Locator panel: Confirm which element matched, if any.
- Network: Look for failed API calls, slow calls, or missing requests.
- Console: Check client-side exceptions.
- Source: Jump back to the exact TypeScript line.
Example: distinguish product bug from test bug
Imagine the success message never appears. The trace shows the button click happened, the request returned 500, and the console logged an uncaught error. That is not a locator issue. That is a product or environment issue, and your bug report should include the failed API endpoint and the trace link.
Now imagine the request returns 200, the DOM contains Order confirmed, but the test looks for .success and the class changed to .toast-success. That is a test locator issue. The fix is not to file a product bug. The fix is to use a semantic locator or a stable test id.
// Weak: depends on CSS implementation
await expect(page.locator('.toast-success')).toContainText('Order confirmed');

// Better: depends on user-visible role and message
await expect(page.getByRole('status')).toContainText('Order confirmed');

// Also acceptable when the UI has no semantic role yet
await expect(page.getByTestId('order-confirmation')).toContainText('Order confirmed');
If your team still debates locator strategy, read ScrollTest’s toast notification testing in Playwright. Toasts expose many timing and locator mistakes that also appear in checkout, search, and notification flows.
Debugging Playwright Failures in CI
CI debugging is different from local debugging. You usually cannot watch the browser live. Your artifacts must tell the story: report, trace, screenshot, video, console, network, and environment metadata.
GitHub Actions example
This workflow installs browsers, runs tests, and uploads the Playwright report even when the test job fails.
name: Playwright Tests

on:
  push:
    branches: [main]
  pull_request:

jobs:
  test:
    runs-on: ubuntu-latest
    timeout-minutes: 30
    steps:
      - uses: actions/checkout@v4
      - uses: actions/setup-node@v4
        with:
          node-version: 22
          cache: npm
      - run: npm ci
      - run: npx playwright install --with-deps
      - run: npx playwright test
        env:
          CI: true
          BASE_URL: ${{ secrets.STAGING_BASE_URL }}
      - uses: actions/upload-artifact@v4
        if: always()
        with:
          name: playwright-report
          path: playwright-report/
          retention-days: 7
      - uses: actions/upload-artifact@v4
        if: always()
        with:
          name: test-results
          path: test-results/
          retention-days: 7
What to inspect first in CI
When a CI failure arrives in Slack or email, I use this checklist:
- Did the same test fail on retry?
- Did it fail in one browser or all browsers?
- Did it fail before login, after login, or after a backend action?
- Does the screenshot show a blank page, wrong account, stale modal, or real UI error?
- Does the trace show a failed network call?
- Did the branch change test data, environment config, or locator text?
This is also where sharding matters. If your team runs a large suite, revisit Playwright CI sharding with TypeScript. Debugging one shard is easier when each shard uploads its own report and trace artifacts.
Add useful logs without printing secrets
Sometimes the browser trace is not enough. You need application metadata, but you must never dump access tokens or customer data into CI logs.
test.beforeEach(async ({ page }, testInfo) => {
  page.on('console', msg => {
    if (msg.type() === 'error') {
      console.log(`[browser-console-error] ${msg.text()}`);
    }
  });

  page.on('requestfailed', request => {
    console.log(`[request-failed] ${request.method()} ${request.url()} ${request.failure()?.errorText}`);
  });

  testInfo.annotations.push({
    type: 'baseURL',
    description: process.env.BASE_URL ?? 'local'
  });
});
Keep logs boring and safe. A failed URL, method, status, feature flag name, and test user role are usually enough. Access tokens, cookies, OTPs, and real user records do not belong in artifacts.
Common Debugging Pitfalls
Most debugging mistakes come from impatience. A red test makes people want the fastest green build. That is how suites become flaky.
Pitfall 1: adding fixed waits
waitForTimeout feels productive because the test may pass after the patch. But it also makes the suite slower and hides the real signal. Prefer web-first assertions.
// Avoid this
await page.waitForTimeout(5000);
await expect(page.getByText('Saved')).toBeVisible();

// Prefer this
await expect(page.getByText('Saved')).toBeVisible({ timeout: 10_000 });
Pitfall 2: debugging the wrong browser
If CI failed only on WebKit, do not debug only in Chromium. Run the same project locally if possible:
npx playwright test tests/checkout.spec.ts --project=webkit --headed
Browser-specific failures often come from date inputs, hover behavior, file uploads, permissions, viewport size, or CSS differences. The trace tells you where to look.
Pitfall 3: ignoring test isolation
A test that passes alone and fails in the suite often has shared state. Common causes include reused accounts, leftover cart data, unclosed dialogs, storage state pollution, and order-dependent records.
test.describe.configure({ mode: 'parallel' });

test('creates a unique order', async ({ page }) => {
  const email = `qa-${Date.now()}-${test.info().parallelIndex}@example.com`;
  await page.goto('/checkout');
  await page.getByLabel('Email').fill(email);
});
This is not perfect test data management, but it shows the idea: unique data beats mystery collisions.
Pitfall 4: treating every red test as flakiness
Flakiness is a diagnosis, not a mood. A test is flaky only when the same code and same environment produce inconsistent outcomes. If the API returns 500 every time, call it a product or environment failure.
India Career Context for SDETs
For Indian QA engineers, Playwright debugging TypeScript is a strong interview signal. Many candidates can write a happy-path login test. Fewer can explain how they use traces, screenshots, network logs, retries, and isolation to protect a release.
In service companies such as TCS, Infosys, Wipro, and Cognizant, you may inherit legacy Selenium suites and slow release cycles. In product companies and funded startups, the expectation is usually different: own CI failures, debug with developers, and reduce flaky noise without waiting for a separate automation architect.
How I would answer in an interview
If an interviewer asks, “How do you debug a flaky Playwright test?”, do not say, “I add waits.” Use a structured answer:
- I reproduce the failure with one spec and one browser project.
- I check the HTML report, screenshot, and trace.
- I classify the failure as locator, assertion, timing, data, environment, or product.
- I fix the root cause with semantic locators, web-first assertions, better test data, or environment config.
- I keep retries as a safety net, not as the main fix.
That answer shows ownership. It also tells the hiring manager you can operate in a modern CI/CD setup, not just write scripts on a laptop.
Portfolio task for this week
Add a small “debugging evidence” section to your GitHub Playwright project. Include:
- A screenshot of UI Mode running a single spec.
- A trace viewer screenshot showing a failed assertion.
- A README section explaining your failure classification checklist.
- A GitHub Actions artifact screenshot for the HTML report.
This is screenshot-able proof. For The Testing Academy learners, this kind of artifact works better than saying “I know Playwright” on a resume.
Key Takeaways
Playwright debugging TypeScript becomes easy when you stop guessing and follow a repeatable triage loop.
- Run the smallest failing scope first: one file, one test, one browser.
- Use UI Mode and Inspector for local reproduction.
- Use trace viewer to separate product bugs from test bugs.
- Configure CI to retain screenshots, videos, traces, reports, and test-results on failure.
- Avoid fixed waits. Prefer semantic locators and web-first assertions.
- In interviews, explain your debugging classification, not just your tool commands.
Day 31 is not about memorizing every Playwright flag. It is about building a debugging habit that keeps your suite trusted after the first 100 tests.
FAQ
What is the best first command for Playwright debugging TypeScript?
Start with the smallest failing run: npx playwright test path/to/spec.ts --project=chromium. If the failure is visual or timing-related, add --headed or use PWDEBUG=1.
Should I keep Playwright trace on for every CI test?
For small suites, always-on traces may be acceptable. For larger suites, I prefer retain-on-failure or on-first-retry to control artifact size while still preserving failure evidence.
Is UI Mode better than trace viewer?
They solve different problems. UI Mode is great while developing and reproducing locally. Trace viewer is better when you need to inspect a completed run, especially a CI failure.
How do I know if a failure is a product bug?
Check the trace. If the user action happened correctly and the network, console, or UI shows broken app behavior, treat it as a product bug. Attach the trace, screenshot, browser, environment, and failed endpoint to the ticket.
Can I use fixed waits for debugging?
You can use a temporary pause while investigating, but do not commit fixed waits as the final fix. Replace them with web-first assertions, stable locators, and better state checks.