JMeter Performance Testing That Actually Works: From Realistic Load Modeling to CI/CD Integration
Black Friday 2025. An online retailer’s checkout system collapsed at 11:47 AM under 23,000 concurrent users. The site had handled 15,000 concurrent users in previous sales. The engineering team had tested for 20,000. But nobody tested what happens when 23,000 users hit the payment API simultaneously while the product recommendation engine is also under peak load.
🎭 Want to master this with real projects? Join the Playwright Automation Mastery course at The Testing Academy.
The outage lasted 47 minutes. Estimated revenue loss: $2.1 million. The post-mortem revealed that the team had done performance testing — but they’d tested individual endpoints, not the system under realistic load patterns. Their JMeter scripts were technically correct and strategically useless.
This guide is about building JMeter performance tests that actually predict production behavior.
Contents
Why Most JMeter Tests Fail to Predict Production Issues
Most teams approach JMeter like a tool for generating HTTP requests. They create thread groups, add HTTP samplers, configure some assertions, and run the test. The results show response times and throughput. Everyone nods and moves on.
The problem is that production load isn’t just “lots of requests.” It’s lots of different requests, from different user journeys, with different data, hitting different service layers, at different rates, with realistic think times and session patterns. A JMeter test that sends 10,000 identical GET requests to a single endpoint tests nothing useful about production readiness.
Setting Up JMeter for Realistic Performance Testing
Step 1: Install and Configure JMeter
Download Apache JMeter from the official site. For serious performance testing, increase the default heap size. Edit jmeter.bat (Windows) or jmeter.sh (Linux/Mac) and set:
# In jmeter.sh or setenv.sh
HEAP="-Xms2g -Xmx4g"
# For large tests, you may need more
# HEAP="-Xms4g -Xmx8g"

# Run in non-GUI mode for actual tests (GUI is for design only)
jmeter -n -t test_plan.jmx -l results.jtl -e -o report/
Critical rule: never run actual performance tests in JMeter’s GUI mode. The GUI consumes significant resources and skews results. Use GUI mode only for designing test plans. Execute tests from the command line.
Step 2: Model Real User Behavior
Before writing a single JMeter element, analyze your production traffic patterns. What percentage of users browse products? What percentage add to cart? What percentage complete checkout? What’s the average session duration? How long do users wait between actions?
For the e-commerce example, a realistic user journey distribution might look like: 60% browse only (view 3-5 product pages), 25% browse and add to cart, 10% complete checkout, 5% use search extensively. Each journey has different response time expectations and different server resource requirements.
Step 3: Create Thread Groups That Reflect Reality
Instead of one thread group with 10,000 threads, create multiple thread groups representing different user personas:
<!-- JMeter Test Plan Structure -->
Test Plan
├── Thread Group: Browsers (60% of load)
│   ├── HTTP Request: Homepage
│   ├── Uniform Random Timer (2-8 seconds)
│   ├── HTTP Request: Category Page
│   ├── Uniform Random Timer (3-10 seconds)
│   ├── Loop Controller (3-5 iterations)
│   │   ├── HTTP Request: Product Detail
│   │   └── Uniform Random Timer (5-15 seconds)
│   └── HTTP Request: Homepage (exit)
│
├── Thread Group: Cart Users (25% of load)
│   ├── HTTP Request: Homepage
│   ├── HTTP Request: Product Search
│   ├── HTTP Request: Product Detail
│   ├── HTTP Request: Add to Cart (POST)
│   ├── Uniform Random Timer (10-30 seconds)
│   ├── HTTP Request: View Cart
│   └── HTTP Request: Homepage (abandon)
│
├── Thread Group: Checkout Users (10% of load)
│   ├── HTTP Request: Homepage
│   ├── HTTP Request: Product Detail
│   ├── HTTP Request: Add to Cart (POST)
│   ├── HTTP Request: Checkout Page
│   ├── HTTP Request: Apply Discount (POST)
│   ├── HTTP Request: Payment API (POST)
│   └── HTTP Request: Order Confirmation
│
└── Thread Group: Search Users (5% of load)
    ├── HTTP Request: Homepage
    ├── Loop Controller (5-10 iterations)
    │   ├── HTTP Request: Search API
    │   ├── Uniform Random Timer (3-8 seconds)
    │   └── HTTP Request: Product Detail
    └── HTTP Request: Homepage
Step 4: Configure Realistic Ramp-Up
Production load doesn’t jump from 0 to 20,000 instantly. It ramps up gradually, often with a predictable pattern. Configure your thread groups with realistic ramp-up periods.
# Thread Group Configuration for Realistic Load
# Target: 5,000 concurrent users over 30 minutes

Thread Group: Browsers
  - Number of Threads: 3000
  - Ramp-Up Period: 600 seconds (10 minutes)
  - Loop Count: Forever
  - Duration: 1800 seconds (30 minutes)
  - Startup Delay: 0

Thread Group: Cart Users
  - Number of Threads: 1250
  - Ramp-Up Period: 600 seconds
  - Loop Count: Forever
  - Duration: 1800 seconds
  - Startup Delay: 60

Thread Group: Checkout Users
  - Number of Threads: 500
  - Ramp-Up Period: 600 seconds
  - Loop Count: Forever
  - Duration: 1800 seconds
  - Startup Delay: 120

Thread Group: Search Users
  - Number of Threads: 250
  - Ramp-Up Period: 300 seconds
  - Loop Count: Forever
  - Duration: 1800 seconds
  - Startup Delay: 0
Step 5: Add Assertions That Matter
Don’t just check for HTTP 200. Add response time assertions, content assertions, and throughput assertions that reflect your SLAs.
# Key Assertions for E-Commerce Performance Test

# Response Time Assertions
- Homepage: < 2 seconds (P95)
- Product Detail: < 3 seconds (P95)
- Search API: < 1.5 seconds (P95)
- Add to Cart: < 1 second (P95)
- Payment API: < 5 seconds (P95)
- Checkout Page: < 3 seconds (P95)

# Error Rate Assertions
- Overall error rate: < 1%
- Payment API error rate: < 0.1%
- Search API error rate: < 0.5%

# Throughput Assertions
- Minimum requests/second: 500
- Payment API minimum: 50 transactions/second
Advanced JMeter Techniques
Distributed Testing for High Load
A single JMeter instance can realistically generate 1,000-3,000 concurrent threads depending on hardware. For higher loads, use JMeter's distributed testing mode with multiple load generator machines.
# Configure distributed testing
# On each slave machine, start JMeter server:
jmeter-server -Djava.rmi.server.hostname=192.168.1.101

# On master machine, configure remote_hosts in jmeter.properties:
remote_hosts=192.168.1.101,192.168.1.102,192.168.1.103

# Run distributed test from master:
jmeter -n -t test_plan.jmx -l results.jtl   -R 192.168.1.101,192.168.1.102,192.168.1.103   -e -o report/
Parameterized Test Data
Hardcoded test data creates unrealistic caching patterns. Use CSV Data Set Config to feed realistic, varied data into your tests. Create CSV files with user credentials, product IDs, search terms, and shipping addresses that represent your production data distribution.
# users.csv
username,password,user_type
user001@test.com,pass123,premium
user002@test.com,pass456,standard
user003@test.com,pass789,premium
...

# search_terms.csv
term,expected_results_min
running shoes,10
bluetooth headphones,5
laptop stand,3
organic coffee,8
...
🚀 Level Up Your Playwright
From locators to CI pipelines — build a production-grade Playwright + TypeScript framework step by step.
Correlation and Dynamic Data
Real applications use session tokens, CSRF tokens, and dynamic IDs. Use JMeter's Regular Expression Extractor or JSON Extractor to capture these values from responses and use them in subsequent requests. Without correlation, your tests will fail with authentication errors that have nothing to do with performance.
Interpreting Results: What Actually Matters
P95 and P99 Response Times: Average response time is misleading. If your average is 500ms but P99 is 8 seconds, 1% of your users are having a terrible experience. Focus on percentiles, not averages.
Error Rate Under Load: A 0.1% error rate at 1,000 users that jumps to 5% at 5,000 users indicates a resource bottleneck. Identify the inflection point and work backward to the cause.
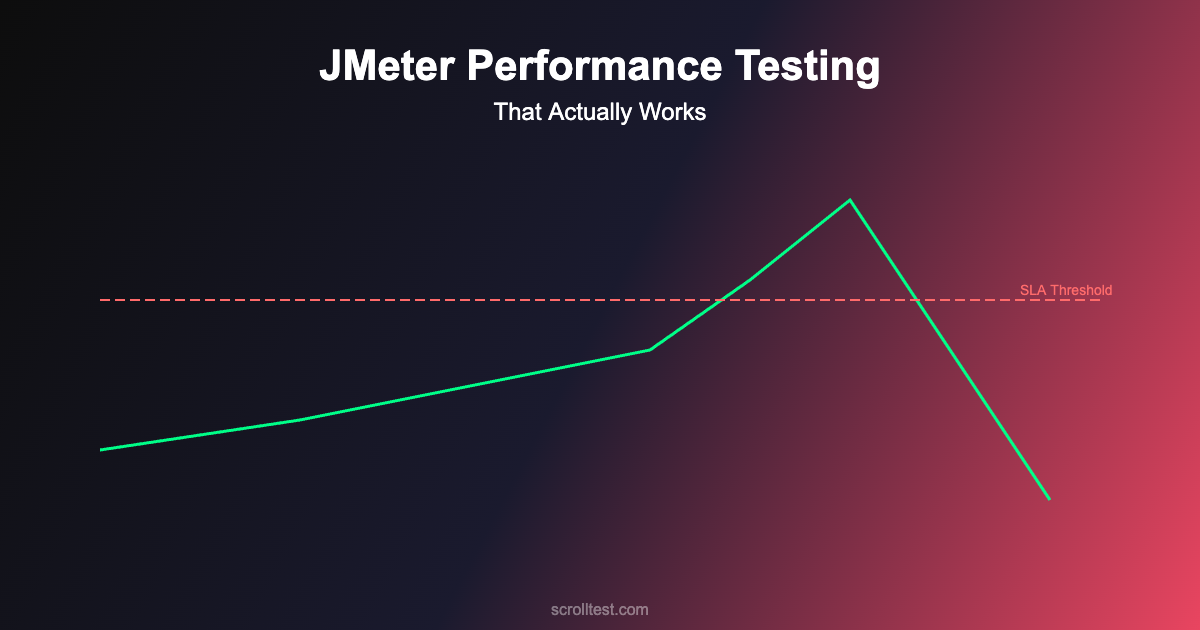
Throughput Plateau: When throughput stops increasing despite adding more threads, you've found a bottleneck. The system is saturated. Adding more load will only increase response times and error rates.
Resource Correlation: Always monitor server-side resources (CPU, memory, disk I/O, network) alongside JMeter results. A response time spike that correlates with CPU hitting 100% points to a different fix than one that correlates with database connection pool exhaustion.
Common JMeter Mistakes
Running tests in GUI mode: GUI mode adds significant overhead. Always use CLI mode (jmeter -n) for actual test execution.
No think time between requests: Real users don't send requests at machine speed. Without think times, you're testing a DDoS attack scenario, not user load.
Testing from the same machine as the server: This creates resource contention. JMeter and the application compete for CPU and memory, skewing results.
Ignoring ramp-up: Instant load spikes create thundering herd problems that don't reflect production. Use gradual ramp-up periods.
Not clearing results between runs: Accumulated results from multiple runs produce misleading aggregate statistics. Start fresh each time.
JMeter + CI/CD Integration
Performance tests should run automatically as part of your deployment pipeline. Here's a GitHub Actions workflow for automated JMeter testing:
name: Performance Tests
on:
  push:
    branches: [main]
  schedule:
    - cron: '0 2 * * 1'  # Weekly Monday 2 AM

jobs:
  performance-test:
    runs-on: ubuntu-latest
    steps:
      - uses: actions/checkout@v4

      - name: Install JMeter
        run: |
          wget https://dlcdn.apache.org/jmeter/binaries/apache-jmeter-5.6.3.tgz
          tar -xzf apache-jmeter-5.6.3.tgz

      - name: Run Performance Tests
        run: |
          ./apache-jmeter-5.6.3/bin/jmeter -n             -t tests/performance/load_test.jmx             -l results/results.jtl             -e -o results/report/             -JTARGET_HOST=staging.example.com             -JTHREAD_COUNT=500             -JDURATION=600

      - name: Check Thresholds
        run: |
          python scripts/check_perf_thresholds.py             --results results/results.jtl             --max-p95 3000             --max-error-rate 1.0

      - name: Upload Report
        uses: actions/upload-artifact@v4
        with:
          name: jmeter-report
          path: results/report/
Frequently Asked Questions
How many concurrent users should I test for?
Test for 2-3x your expected peak load. If you expect 10,000 concurrent users during a sale, test for 20,000-30,000. This gives you a safety margin and helps identify the breaking point before production finds it for you.
How long should a performance test run?
Minimum 30 minutes for load tests, ideally 1-2 hours. Short tests miss problems like memory leaks, connection pool exhaustion, and garbage collection pressure that only appear under sustained load. For soak tests, run 4-8 hours or overnight.
Should I test against production or staging?
Staging — but ensure your staging environment mirrors production infrastructure. Same server specs, same database size, same network configuration. Testing against a staging environment with half the production resources gives you half-useful results.
What's the difference between load, stress, and soak testing?
Load testing verifies the system handles expected traffic. Stress testing pushes beyond expected limits to find the breaking point. Soak testing runs at normal load for extended periods to find memory leaks and degradation. You need all three.
The Bottom Line
The retailer that lost $2.1 million on Black Friday didn't skip performance testing. They did performance testing badly. They tested individual endpoints instead of user journeys. They used uniform load instead of realistic patterns. They checked averages instead of percentiles.
JMeter is a powerful tool — but it's only as useful as the test plan behind it. Model real user behavior. Create diverse thread groups. Add realistic think times. Test at 2-3x expected peak. Monitor server resources alongside JMeter metrics. Integrate into CI/CD.
Performance testing isn't about proving your system works. It's about finding out where it breaks before your users do.
References
- Apache JMeter User Manual — Official documentation and best practices
- JMeter Distributed Testing Guide — Setting up distributed load generation
- JMeter Best Practices — Official performance testing guidelines
- BlazeMeter JMeter Tutorial — Comprehensive JMeter learning resource
- GitHub Actions — CI/CD integration for automated performance tests
- Grafana — Real-time performance monitoring dashboards
- Selenium Documentation — Browser-based performance testing complement
- Playwright Documentation — Modern alternative for browser performance profiling
- Gatling Documentation — Alternative performance testing tool for comparison
- Ministry of Testing — Performance testing community resources
🎓 Master Playwright End to End
Join hundreds of SDETs building real automation frameworks. Lifetime access, hands-on projects, and a job-ready portfolio.