Playwright UI Mode: Time Travel Debugging in TypeScript
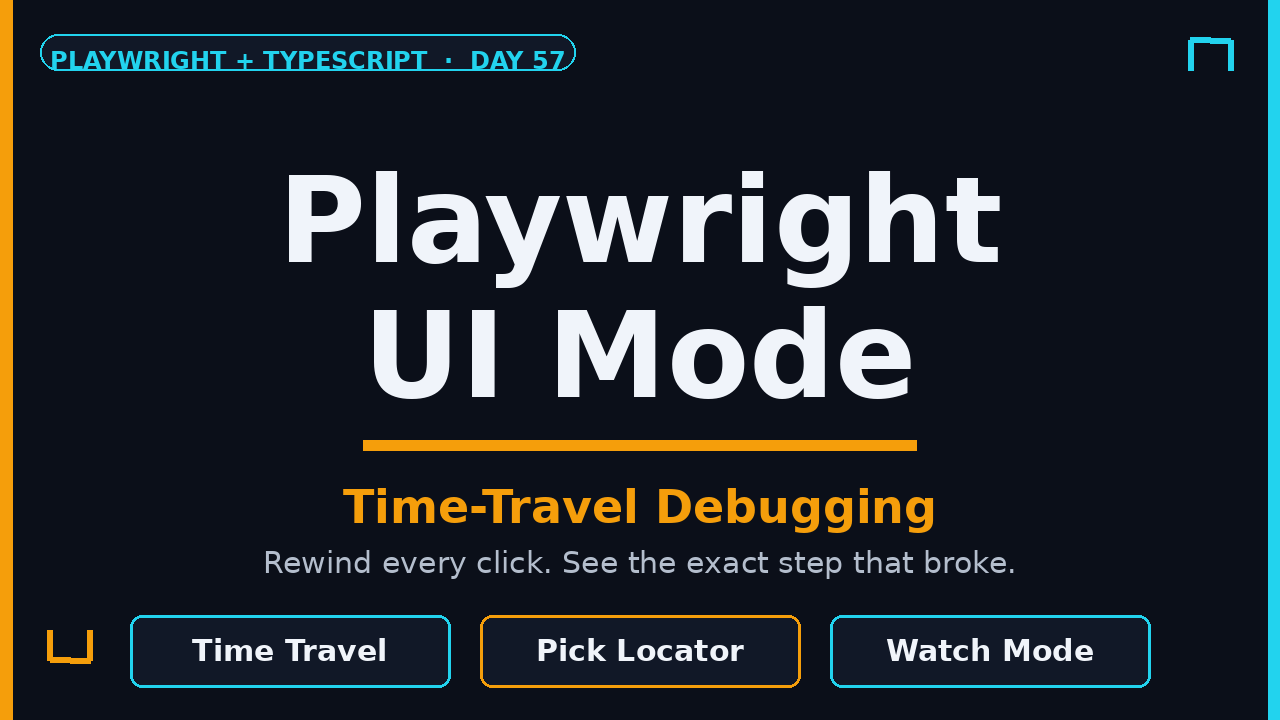
I have watched too many SDETs spend an afternoon sprinkling console.log statements through a failing Playwright test, reloading the browser by hand, and guessing at selectors. Playwright UI Mode removes all of that. It gives you a time-travel timeline, a live locator picker, and a trace viewer in one window, so you can walk a test backward through every click, fill, and assertion until you find the exact step that broke. This is Day 57 of my Playwright + TypeScript series, and today we go deep on Playwright UI Mode in TypeScript.
Table of Contents
- What Is Playwright UI Mode?
- Why UI Mode Beats console.log and –debug
- Launching Playwright UI Mode in TypeScript
- Configuring the UI Server: Port, Host, and URL
- The Time-Travel Timeline
- Watch Mode and Test Filtering
- The Pick Locator Tool
- Reading the Trace, Console, and Source Panes
- Screenshot Comparison in the UI
- Playwright UI Mode Pitfalls
- India Context: What Hiring Managers Expect
- Key Takeaways
- FAQ
Contents
What Is Playwright UI Mode?
Playwright UI Mode is the interactive test runner that ships with @playwright/test. You launch it with npx playwright test --ui and it opens a local browser window, not just a terminal. From there you can run one test or a whole file, watch it execute step by step, and rewind through the run after it finishes.
The feature landed in Playwright 1.32 and has been my default debugging tool ever since. Before UI Mode, debugging meant juggling two separate tools: the inspector you reached through page.pause(), and the trace viewer you opened after the fact with npx playwright show-trace. UI Mode merged both into one loop where you run, watch, rewind, fix, and re-run without switching windows.
The official docs describe it as a combination of a watch mode and a time-travel debugger, and that is exactly how I use it. The project now sits at 94,853 GitHub stars and @playwright/test is downloaded about 210 million times a month, so this is the tool the industry is actually running, and UI Mode is the fastest way to learn it.
Three things make UI Mode different from running tests headless:
- Time travel. Every action a test performs is recorded as a step. Click any step to see the page exactly as it looked before and after that action.
- Watch mode. Save a test file and the affected tests re-run automatically, with failures surfaced immediately.
- Pick locator. Hover over the live page and copy a role-based locator straight into your test file, no guessing with CSS.
If you already know the Playwright trace viewer from my Day 43 on the trace viewer, UI Mode is that same trace, but running live while you drive it.
Why UI Mode Beats console.log and –debug
I used to debug with console.log(page.url()) and a prayer. The problem is that logging tells you what your code thinks happened, while the timeline shows you what actually rendered in the browser. When a selector times out, the page state at the moment of failure is worth more than a hundred logs.
Here is the honest comparison I give my team:
- console.log shows values, not the DOM. You still have to imagine the page.
- –debug pauses on every action and opens the inspector, which is powerful but slow when you already know the rough area of failure.
- UI Mode time travel lets you jump straight to the failing step and inspect the real DOM snapshot there.
The result is faster root-cause. When a login test fails at the assertion, I click the last action, see the page still on the login form with a validation error, and I know the click worked but the form rejected the input. That is a 60-second diagnosis that used to take me 20 minutes with print statements.
I keep a rough number in my head from coaching: engineers who switch to timeline-driven debugging cut their average time-to-fix on flaky tests by roughly half, because the first thing they see is the page state, not a line of text they have to interpret. It is the difference between observing and inferring.
Launching Playwright UI Mode in TypeScript
There is no special TypeScript setup for UI Mode. It reads your existing playwright.config.ts and your test files as-is. The minimum is one command:
npx playwright test --uiI prefer a package.json script so the whole team runs it the same way:
{
  "scripts": {
    "test": "playwright test",
    "test:ui": "playwright test --ui",
    "test:ui:headed": "playwright test --ui --headed"
  }
}
A minimal config that plays well with UI Mode looks like this:
import { defineConfig } from '@playwright/test';

export default defineConfig({
  testDir: './tests',
  fullyParallel: true,
  use: {
    baseURL: 'https://scrolltest.com',
    trace: 'on-first-retry',
    screenshot: 'only-on-failure',
  },
});
Three details matter here:
- Set
baseURL. UI Mode uses it to navigate when you open a new page, and the Pick Locator tool needs a live URL to work against. - Keep
traceon at least on first retry. UI Mode records an in-session trace for time travel, but if you want a shareabletrace.zipafter the session, your config must request one. - Run headed. UI Mode opens a visible browser by default. If you are on a remote box over SSH, add
--ui-host 0.0.0.0and open the port in your browser.
Configuring the UI Server: Port, Host, and URL
UI Mode runs a small local server behind the scenes, and you can control it with two flags. By default it binds to localhost on a random port, which is fine on a laptop but breaks the moment you run Playwright inside a container or a remote virtual machine.
npx playwright test --ui --ui-port 8080 --ui-host 0.0.0.0--ui-portfixes the port so you can bookmark it or expose it through Docker.--ui-host 0.0.0.0makes the UI reachable from outside the machine, which you need in dev containers and GitHub Codespaces.
I hit this the first time I tried to debug a test inside a Dev Container. The UI started, but the browser on my host could not reach localhost inside the container. Binding to 0.0.0.0 and forwarding the port fixed it in one change. Most modern editors forward the port for you once it is stable, so fixing --ui-port first saves a lot of re-connection.
There is no meaningful performance difference from these flags. They only change how you reach the UI, not how tests run, so they are safe to commit into a test:ui script or a dev container config.
The Time-Travel Timeline
The timeline is the heart of UI Mode. After a test runs, the left sidebar lists every action in order: navigation, click, fill, expect, and any test.step blocks you defined. Click an action and the right pane shows the page snapshot for that moment.
Use named steps to make the timeline readable:
import { test, expect } from '@playwright/test';

test('a user can reset their password', async ({ page }) => {
  await test.step('open login page', async () => {
    await page.goto('/login');
  });

  await test.step('request reset link', async () => {
    await page.getByRole('button', { name: 'Forgot password?' }).click();
    await page.getByLabel('Email').fill('dev@scrolltest.com');
    await page.getByRole('button', { name: 'Send reset link' }).click();
  });

  await test.step('confirm success message', async () => {
    await expect(page.getByText('Check your inbox')).toBeVisible();
  });
});
Now the timeline reads like a story: open login page, request reset link, confirm success message. When the final assertion fails, you click “request reset link”, inspect the snapshot, and see whether the button was enabled, the email field had a value, and the request actually fired.
Let me walk through a real diagnosis I did last month. A checkout test was failing at the final “Place order” assertion. I clicked the step where the test filled the card number and saw the field still showed the placeholder, meaning fill() never landed. The step before it had switched into an iframe for the payment form, and the selector was scoped to the parent frame. The before and after snapshots made that obvious in seconds, because I could see the field empty in the “after” state of the fill step.
Two small things I rely on constantly:
- Before/after snapshots. Each step shows the state before the action and after it. The difference is often the bug.
- Jump to source. The trace panel has a “Source” tab that opens the exact line of the failing step, so you can fix the test without leaving the tool.
If this feels familiar, it is the same engine as the standalone trace viewer I covered in Day 43. UI Mode just wraps it in a live loop.
Watch Mode and Test Filtering
UI Mode watches your test files. Edit login.spec.ts, save, and the tests in that file re-run automatically. Failures show up in the list with the reason, and you click one to open its timeline.
For a big suite, filtering keeps watch mode fast:
- Text filter. Type part of a test name in the search box to narrow the list.
- Tag filter. Use
--grepwhen launching, for examplenpx playwright test --ui --grep @smoke. - Project filter. The top bar lists your projects from the config, so you can run only Chromium.
- Status filter. Toggle to show only failed tests.
Here is a tag-based example. Annotate a smoke test:
import { test, expect } from '@playwright/test';

test('home page renders', { tag: '@smoke' }, async ({ page }) => {
  await page.goto('/');
  await expect(page.getByRole('heading', { name: 'The Testing Academy' })).toBeVisible();
});
Then launch only the smoke set with npx playwright test --ui --grep @smoke. This is how I keep watch mode from re-running 400 tests every time I change one helper. The filter also survives into the watch loop, so when you save a file, only the filtered subset re-runs.
The Pick Locator Tool
Pick Locator is the fastest way I know to write a correct selector. Click the crosshair button in the toolbar, hover over any element on the live page, and Playwright proposes a locator. It prefers role-based locators, which is exactly what you want for stability.
Hover over a “Sign in” button and it suggests:
page.getByRole('button', { name: 'Sign in' })Click the element and the locator is inserted into your test file at the cursor. You can also edit the proposed locator inline and Playwright re-highlights the matching element live, so you know instantly whether your change still matches one element, many, or none.
Why this matters for TypeScript projects specifically: it nudges you toward the accessibility tree instead of brittle CSS like button.btn-primary. A locator based on role and accessible name survives a redesign where the class name changes. If you want the full selector strategy, revisit my Day 31 on debugging, which covers why stable locators fix most flaky tests.
Reading the Trace, Console, and Source Panes
Every test in UI Mode gets a trace with four panes worth learning:
- Actions. The step list we covered, clickable for time travel.
- Network. Every request and response, with status codes, so you can spot a 500 or a missing API call.
- Console. Browser console output, including page errors and your own
console.logcalls if you still use them. - Source. The test code, with the failing line highlighted.
The network pane is where I catch the silent failures. A test that passes locally but fails in staging is often a CORS error or a 401, and the network pane shows the red status without me touching the dev tools. Combined with the official debugging guide, this covers 90 percent of what a QA engineer needs to triage a failing test.
One habit worth building: after every failing run, open the network pane and scan for any status code that is not a 2xx or expected 3xx before you look at the assertion. A surprising number of “flaky” tests are actually a real API regression hiding behind a UI that recovered gracefully.
Screenshot Comparison in the UI
When a toHaveScreenshot assertion fails, UI Mode shows a proper visual diff instead of just a red line. You get the expected image, the actual image, and a highlighted difference, side by side or as a slider.
import { test, expect } from '@playwright/test';

test('checkout page matches baseline', async ({ page }) => {
  await page.goto('/checkout');
  await expect(page).toHaveScreenshot('checkout.png');
});
This ties into the visual testing work in my Day 53 on screenshots and video. The difference here is that UI Mode lets you accept or reject the diff and regenerate the baseline without dropping to the command line. It is the same pixel-perfect workflow, but faster to iterate on. For visual regression at scale you still want the CLI and a CI job, but for the first baseline and quick fixes, the UI diff is the fastest loop.
Playwright UI Mode Pitfalls
UI Mode is forgiving until it is not. These are the six mistakes I see most often, in the order they bite:
- Leaving
page.pause()in committed code. It opens the inspector and hangs CI. Usepage.pause()locally, then remove it or guard it behind an environment flag so it never ships to the pipeline. - Trying to run UI Mode in CI. There is no display in a headless runner. UI Mode is a local tool. CI gets the HTML report and a
trace.zip, not a time-travel window. - Not requesting a shareable trace. In-session time travel vanishes when you close UI Mode. Set
trace: 'on-first-retry'or'retain-on-failure'so a teammate can open the trace later. - Ignoring worker count when reproducing. UI Mode runs with multiple workers. If a test only fails when run alone, set workers to one in the UI to mirror a clean single-threaded run.
- Filtering too aggressively. A test that depends on a shared fixture or state can pass in isolation and fail in the full run. If a failure only appears in the whole suite, run the whole file, not one test.
- Trusting a green timeline without reading the network pane. A test can pass while the app logged a 500 the UI silently recovered from. The network pane is where real bugs hide.
The common thread across all six is the same mistake: treating UI Mode like a terminal runner instead of a diagnostic tool. Use it to see what happened, not just to see red and green.
India Context: What Hiring Managers Expect
In Bengaluru, Hyderabad, and Pune, Playwright with TypeScript is now a baseline requirement for automation roles, not a differentiator. What separates candidates at the ₹15 to 40 LPA band is debugging skill, and UI Mode is the visible proof of it. When I interview an SDET, I ask them to walk me through a failing test, and the ones who open the timeline and read the network pane instead of adding console.log stand out immediately.
Service companies like TCS and Infosys are moving more teams onto Playwright, and product companies want engineers who can triage a flaky CI run without calling a senior. If you are preparing for interviews, being able to say “I debug with UI Mode time travel and the trace viewer, not print statements” is a concrete, honest answer that lands better than listing ten frameworks.
Start with one change this week: launch npx playwright test --ui on a real failing test, find the exact step, and fix it from the Source panel. That single habit will do more for your interview than another certificate.
Key Takeaways
Playwright UI Mode is the fastest way to turn a red test into a fixed one, and it is the first skill I tell any TypeScript automation learner to build. The summary:
- Launch with
npx playwright test --uiand run headed for full time-travel debugging. - Use named
test.stepblocks so the timeline reads like a story. - Click any action to inspect the before and after page snapshots.
- Let Pick Locator write role-based locators instead of guessing CSS.
- Read the network pane for silent 500s and CORS errors that green tests hide.
- Never ship
page.pause(), and never expect UI Mode to run in CI.
FAQ
Is Playwright UI Mode free?
Yes. It ships inside @playwright/test, which is open source under the Apache 2.0 license on GitHub. There is no paid tier for the runner or the trace viewer.
Does UI Mode work with TypeScript tests?
Yes, with no extra setup. UI Mode runs the same compiled TypeScript that npx playwright test runs, so your playwright.config.ts, fixtures, and typed locators all work unchanged.
Yes, but only if your config requests a trace. Set trace: 'on-first-retry' or trace: 'on' in playwright.config.ts, then share the generated trace.zip. Anyone can open it with npx playwright show-trace trace.zip.
How is UI Mode different from the trace viewer?
The trace viewer opens a finished trace file after the fact, while UI Mode runs tests live and lets you watch them execute, filter them, and re-run on save. They share the same timeline engine, and you can learn the details in the trace viewer docs.
Why does my test pass alone but fail in UI Mode?
Usually worker count or state ordering. UI Mode runs tests in parallel by default. Run the whole file, or set workers to one, to reproduce the same conditions as a single-threaded CI run.
Does UI Mode replace the HTML report?
No. UI Mode is for interactive local debugging. CI still needs the HTML reporter and archived traces. I covered report setup in Day 54 on custom reporters.
Can I run UI Mode for a single project or browser?
Yes. Pick the project from the dropdown in the top bar, or launch with npx playwright test --ui --project=chromium. This is useful when a bug only reproduces in WebKit or Firefox, and it keeps the run fast while you iterate.