Playwright Trace Viewer Debugging: Day 43
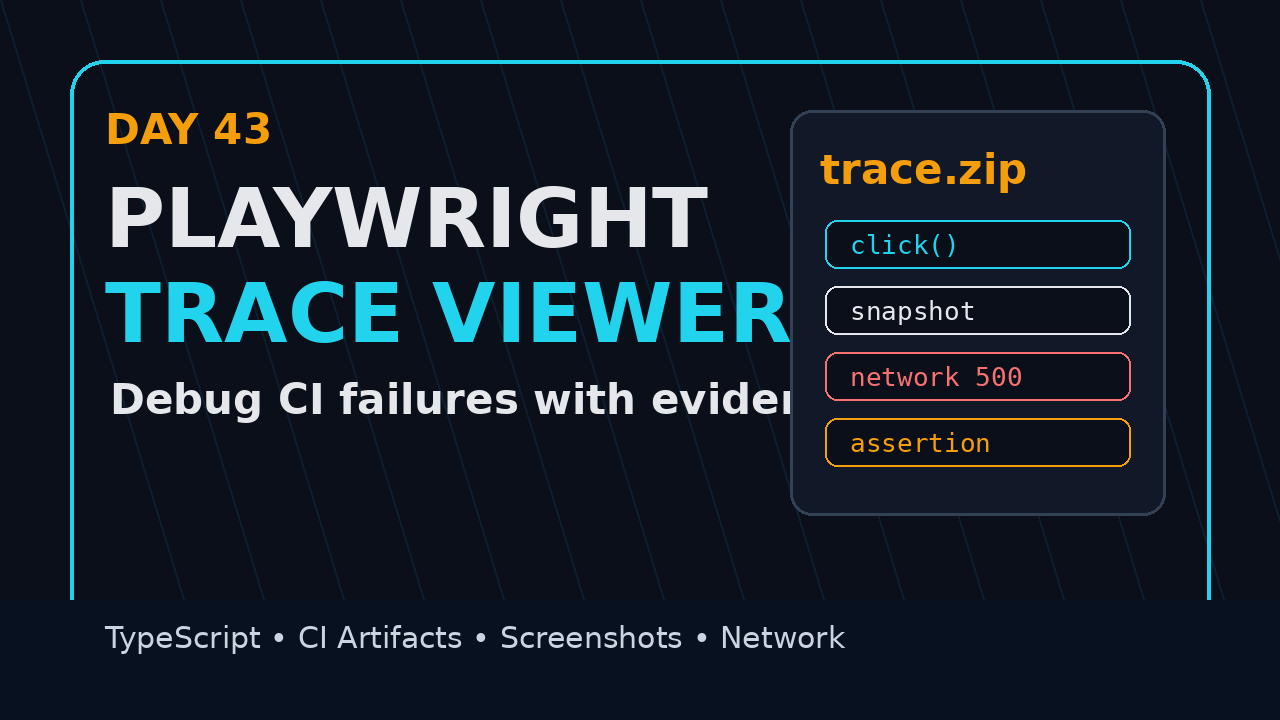
Playwright Trace Viewer becomes useful the first time a CI-only failure wastes 40 minutes of your morning. Day 43 of this Playwright + TypeScript series is about turning a failing run into evidence: action snapshots, DOM state, console logs, network calls, screenshots, and video when needed.
I see many SDETs enable traces only after the suite is already painful. That is backwards. A good trace policy is cheap insurance, especially for teams running sharded Playwright suites in GitHub Actions, Azure DevOps, Jenkins, or any internal grid.
Table of Contents
- What Playwright Trace Viewer Solves
- Project Setup for TypeScript Traces
- Choose the Right Trace Mode
- A Practical Debugging Workflow
- CI Artifacts That Make Traces Useful
- Screenshots, Video, Console, and Network
- Common Pitfalls I See in Teams
- Key Takeaways
- FAQ
Contents
What Playwright Trace Viewer Solves
The official Playwright Trace Viewer documentation describes traces as a way to explore a recorded Playwright run after the script has finished. That small sentence matters. A trace is not just a screenshot. It is a time machine for the failed test.
When a test fails locally, you can add await page.pause(), run headed mode, or debug in VS Code. CI failures are different. You usually have no browser window, no human observing the flow, and no reliable way to reproduce the same network speed, login state, viewport, or server timing. The Playwright Trace Viewer closes that gap.
The debugging problem
Most flaky investigations start with weak evidence:
- A red CI job.
- A line number that points to an assertion.
- A screenshot taken after the page has already changed.
- A tester guessing whether the app, selector, data, or environment caused the failure.
That is not enough. If you work in a product company, a vague flaky bug report gets ignored. If you work in a service company like TCS, Infosys, or Wipro, vague evidence burns billable hours and frustrates client teams. In both cases, the fix is the same: ship a trace with the failure.
What the trace contains
A Playwright trace can show each action, locator resolution, DOM snapshot, console message, network request, response, source location, screenshot, and timing. You can move through the test like a film strip and inspect what the browser saw before the failure. That helps you answer four practical questions:
- Did the test click the right element?
- Did the app render the expected state?
- Did an API call fail, slow down, or return different data?
- Did the assertion wait for the wrong signal?
If you read Day 42 on Playwright retries and flaky tests, this lesson is the natural next step. Retries tell you a test is unstable. Traces tell you why.
Project Setup for TypeScript Traces
Start with a clean TypeScript Playwright project. If your team already has a framework, adapt the same config ideas. The goal is not to record everything forever. The goal is to record enough evidence when a test fails.
npm init playwright@latest
npm install -D @playwright/test
npx playwright install
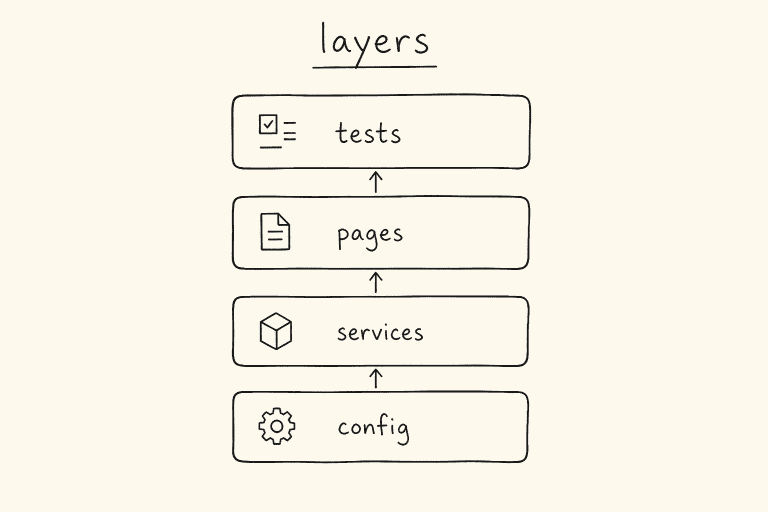
For a practical framework, I keep this folder layout:
tests/
  checkout.spec.ts
  login.spec.ts
pages/
  LoginPage.ts
  CheckoutPage.ts
playwright.config.ts
.github/workflows/playwright.yml
Baseline config
The Playwright test options documentation shows how project-wide settings sit under use. This is where trace, screenshot, video, base URL, locale, and viewport policies belong.
import { defineConfig, devices } from '@playwright/test';

export default defineConfig({
  testDir: './tests',
  timeout: 30_000,
  expect: {
    timeout: 7_000,
  },
  reporter: [
    ['list'],
    ['html', { outputFolder: 'playwright-report', open: 'never' }],
  ],
  use: {
    baseURL: process.env.BASE_URL ?? 'https://example.com',
    trace: 'on-first-retry',
    screenshot: 'only-on-failure',
    video: 'retain-on-failure',
    actionTimeout: 10_000,
    navigationTimeout: 15_000,
  },
  projects: [
    { name: 'chromium', use: { ...devices['Desktop Chrome'] } },
  ],
});
This config gives you a balanced default. The first failed attempt stays light. If the retry fails again or exposes flaky behavior, Playwright keeps a trace. Screenshots and videos are retained only when useful.
A small failing test
Use this intentionally simple test to practice trace reading. It checks a login error message and uses a stable role selector.
import { test, expect } from '@playwright/test';

test('shows login validation for invalid credentials', async ({ page }) => {
  await page.goto('/login');
  await page.getByLabel('Email').fill('wrong@example.com');
  await page.getByLabel('Password').fill('bad-password');
  await page.getByRole('button', { name: 'Sign in' }).click();

  await expect(page.getByText('Invalid email or password')).toBeVisible();
});
If this fails in CI, I want the trace to answer whether the form loaded, whether the fields received text, whether the button click triggered a request, and whether the backend returned a validation response.
Choose the Right Trace Mode
Playwright Trace Viewer is only as useful as your trace policy. I avoid one extreme: trace: 'on' for every suite run. It creates large artifacts, slows uploads, and trains teams to ignore evidence because there is too much of it.
Recommended modes
Use these modes deliberately:
off: good for tiny local smoke checks where speed matters.on: useful for short debugging sessions or a temporary branch.retain-on-failure: keeps traces only when a test fails.on-first-retry: the best default for CI suites that use retries.
The Playwright retries documentation explains that a flaky test is one that fails first and passes on retry. That is exactly why on-first-retry is practical. It records the retry attempt, where timing issues often become visible.
My default policy
For most QA teams, I recommend this policy:
- Local development:
trace: 'off'unless debugging. - Pull request smoke suite:
trace: 'on-first-retry'. - Nightly regression:
trace: 'retain-on-failure'oron-first-retry, depending on artifact budget. - Quarantined flaky suite:
trace: 'on'for a limited time.
Do not keep a heavy policy forever because nobody owns the cleanup. Add a date or issue link when enabling extra trace capture.
const heavyDebug = process.env.TRACE_DEBUG === 'true';

export default defineConfig({
  use: {
    trace: heavyDebug ? 'on' : 'on-first-retry',
    screenshot: 'only-on-failure',
    video: heavyDebug ? 'on' : 'retain-on-failure',
  },
});
This pattern lets you run TRACE_DEBUG=true npx playwright test when a failure is stubborn, without editing source code.
A Practical Debugging Workflow
Good debugging is a repeatable workflow, not a mood. When a CI failure comes in, I use the same seven-step routine. It prevents random changes and protects the team from “try increasing timeout” as the default answer.
Step 1: Open the trace
After a failed run, download the trace zip from the test result or CI artifact. Open it with:
npx playwright show-trace test-results/checkout-should-pay-retry1/trace.zip
You can also open a trace in the browser through the hosted trace viewer mentioned in the official docs, but be careful with private app data. For client projects, local viewing is safer.
Step 2: Check the action before failure
Do not start with the assertion line. Start one action earlier. If the assertion says a success toast was missing, inspect the click that should have caused it. Ask:
- Did the locator match one element or multiple elements?
- Was the element visible and enabled?
- Did Playwright auto-wait for the correct condition?
- Did the UI navigate, reload, or stay on the same page?
Step 3: Inspect the DOM snapshot
The trace snapshot is gold. It shows what the page looked like at that moment. If an element is missing, inspect whether it was never rendered, rendered under a different label, hidden behind a feature flag, or blocked by a modal.
For example, a failing checkout test may show that the payment button is disabled because the cart API returned an empty list. The selector is not the bug. The data setup is the bug.
Step 4: Read the network panel
Network evidence separates test failures from product failures. If a POST /login returns 401 for valid test credentials, you have an environment or seed-data issue. If GET /cart returns 500, you have a backend problem. If no request fires after a button click, the UI event did not happen.
test('checkout request should complete', async ({ page }) => {
  const checkoutResponse = page.waitForResponse(response =>
    response.url().includes('/api/checkout') && response.status() === 200
  );

  await page.getByRole('button', { name: 'Place order' }).click();
  await checkoutResponse;
  await expect(page.getByText('Order confirmed')).toBeVisible();
});
This example does not replace trace debugging. It gives the trace a clearer story because the test waits for the business signal, not just a UI guess.
Step 5: Fix the cause, not the symptom
A trace often exposes one of five root causes:
- Weak locator.
- Wrong wait condition.
- Uncontrolled test data.
- Environment instability.
- Actual product defect.
Each cause needs a different fix. A weak locator needs an accessible role, label, or test id. A wrong wait condition needs a business-level signal. A data issue needs setup through API or fixtures. A product defect needs a bug with trace evidence attached.
CI Artifacts That Make Traces Useful
Traces help only if engineers can find them. A beautiful local setup fails if CI deletes the trace before anyone reads it. The Playwright CI guide and GitHub Actions artifact documentation both matter here.
GitHub Actions setup
name: Playwright Tests
on:
  pull_request:
  push:
    branches: [main]

jobs:
  test:
    runs-on: ubuntu-latest
    steps:
      - uses: actions/checkout@v4
      - uses: actions/setup-node@v4
        with:
          node-version: 20
      - run: npm ci
      - run: npx playwright install --with-deps
      - run: npx playwright test
        env:
          BASE_URL: ${{ secrets.STAGING_BASE_URL }}
      - uses: actions/upload-artifact@v4
        if: always()
        with:
          name: playwright-report
          path: |
            playwright-report/
            test-results/
          retention-days: 7
The key is if: always(). Without it, many teams upload artifacts only on green runs, which is useless. I keep retention to 7 days for normal PR checks and longer for release branches.
Reporter setup
The Playwright reporters documentation covers built-in reporters. For most teams, HTML report plus list output is enough. The HTML report links to traces when they exist, which gives developers a simple path from failed test to trace file.
reporter: process.env.CI
  ? [['list'], ['html', { outputFolder: 'playwright-report', open: 'never' }]]
  : [['list'], ['html', { open: 'on-failure' }]],
If you use a paid reporting tool, keep the same discipline: failed test, trace link, screenshot, video, network clue, owner, and decision. Fancy dashboards do not fix missing evidence.
Screenshots, Video, Console, and Network
Playwright Trace Viewer gives you multiple evidence layers. Use them together. A screenshot tells you what was visible. A DOM snapshot tells you what existed. Console logs tell you what JavaScript complained about. Network calls tell you whether the app got the data it needed.
Screenshot descriptions for your bug report
For this tutorial, use these screenshot descriptions in your internal wiki or Jira template:
- Screenshot 1: Trace Viewer timeline with the failed assertion selected and the previous click highlighted.
- Screenshot 2: DOM snapshot showing the payment button disabled while the cart summary is empty.
- Screenshot 3: Network panel filtered to
/api/cartwith a 500 response visible. - Screenshot 4: HTML report page linking the failed test to
trace.zip.
These screenshots are not decoration. They help developers trust the test result and reduce back-and-forth.
Attach console evidence
When a failure smells like frontend JavaScript, collect console messages directly inside the test. This is helpful when the trace shows a blank component but the root cause sits in a runtime error.
test('profile page loads without console errors', async ({ page }) => {
  const errors: string[] = [];

  page.on('console', message => {
    if (message.type() === 'error') {
      errors.push(message.text());
    }
  });

  await page.goto('/profile');
  await expect(page.getByRole('heading', { name: 'My Profile' })).toBeVisible();

  expect(errors, `Console errors: ${errors.join('\n')}`).toEqual([]);
});
Do not add this assertion to every test blindly. Use it for critical pages, smoke flows, or areas where frontend crashes are common.
Connect this to earlier lessons
If you are building the series from scratch, combine today’s lesson with the ScrollTest guide on Playwright CI sharding with TypeScript. Sharded suites produce more artifacts, so naming and retention become important. Also read Lighthouse performance audits in Playwright if you want to connect traces with performance symptoms.
Common Pitfalls I See in Teams
The tool is strong, but team habits decide whether it creates value. These are the mistakes I see repeatedly in real automation teams.
Pitfall 1: Recording every trace forever
Recording every trace sounds safe. It becomes noise. Artifact uploads get slower, storage grows, and nobody opens the files. Keep heavy tracing for targeted debugging windows.
Pitfall 2: Treating trace as a replacement for clean tests
Trace Viewer helps you debug bad tests. It does not make bad tests good. If your locator strategy is full of brittle CSS paths, traces will simply prove that your selectors are brittle.
// Brittle
await page.locator('div:nth-child(4) > button.primary').click();

// Better
await page.getByRole('button', { name: 'Place order' }).click();
Pitfall 3: Uploading artifacts without a naming convention
If every shard uploads playwright-report with the same name, engineers waste time guessing which artifact belongs to which project. Include browser, shard, and run type in the artifact name.
with:
  name: playwright-report-${{ matrix.browser }}-shard-${{ matrix.shard }}
  path: |
    playwright-report/
    test-results/
Pitfall 4: Ignoring privacy
Traces can contain URLs, text, request data, screenshots, and sometimes customer-like test data. Do not upload sensitive traces to public issue trackers. Mask data in test environments and define who can access CI artifacts.
Pitfall 5: Fixing failures with random timeouts
A timeout increase is sometimes valid, but it should be the last answer, not the first. If the trace shows the app never made the request, a longer timeout only hides the real problem.
Team Checklist Before You Mark the Failure Fixed
Before closing a flaky test ticket, I want the owner to leave a short checklist in the pull request. This sounds small, but it stops the same failure from coming back next week under a different name.
- Attach the trace or HTML report link from the failed CI run.
- Name the root cause: locator, wait, data, environment, or product bug.
- Show the exact code change that prevents the failure.
- Run the fixed test at least five times locally or in a focused CI job.
- Remove any temporary
TRACE_DEBUG=truesetting before merge.
This checklist is especially useful when multiple SDETs share ownership of a large regression pack. It creates a habit: every failure needs evidence, every fix needs a reason, and every trace should teach the next person something useful.
Key Takeaways
Playwright Trace Viewer is one of the best debugging tools in the Playwright + TypeScript stack because it changes the conversation from guessing to evidence.
- Use
trace: 'on-first-retry'as the default CI policy for most teams. - Open the action before the failure, not only the assertion line.
- Use DOM snapshots, console logs, network calls, screenshots, and video together.
- Upload
playwright-report/andtest-results/as CI artifacts withif: always(). - Do not record every trace forever. Keep evidence useful and intentional.
For Indian SDETs aiming for ₹25-40 LPA roles in product companies, this is the kind of debugging maturity interviewers notice. Anyone can write a click-and-assert test. Strong automation engineers explain a failure with proof.
FAQ
Should I enable Playwright Trace Viewer for every test?
No. Use on-first-retry or retain-on-failure for normal CI. Turn on only for short debugging periods or tiny suites where artifact size is not a concern.
Can traces expose sensitive data?
Yes. Traces may include screenshots, DOM text, URLs, and network metadata. Treat them as internal debugging artifacts and control access through your CI platform.
What is the best first thing to inspect in a trace?
Inspect the action immediately before the failure. Then compare the DOM snapshot, network panel, and assertion target. This usually reveals whether the issue is selector, wait, data, environment, or product behavior.
Do I still need screenshots if I have traces?
Yes. Screenshots are quick evidence in reports. Traces are richer evidence for debugging. I keep screenshot: 'only-on-failure' and traces on retry or failure.
What should I learn next?
Next, connect trace debugging with a team-level flaky test process: owner assignment, quarantine rules, retry limits, artifact retention, and a weekly flaky budget review.