Playwright Performance Testing with TypeScript
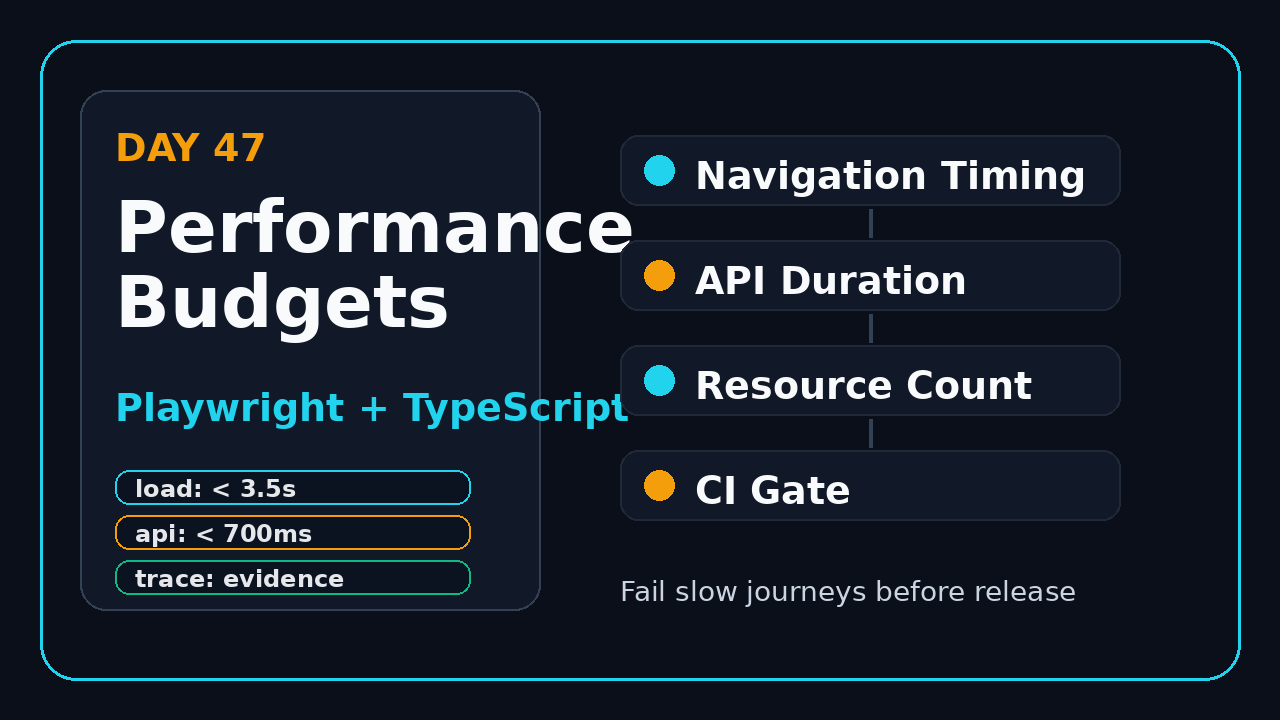
Playwright performance testing is not a replacement for k6, JMeter, Lighthouse, or a full observability stack. It is the fast feedback layer I want inside every Playwright + TypeScript suite: page budgets, API timing, trace evidence, and CI gates that catch obvious slowness before it reaches staging sign-off.
Day 47 of this series is about building that layer without turning your end-to-end tests into fake load tests. We will measure the right browser signals, store evidence, fail only on stable budgets, and keep the suite useful for QA teams that already run Playwright daily.
Table of Contents
- Why performance budgets belong in Playwright
- Playwright performance testing setup
- Measure navigation and web vitals
- API and network performance checks
- CI gates, traces, and reports
- Common pitfalls
- India team context
- Key takeaways
- FAQ
Contents
Why performance budgets belong in Playwright
I see one common mistake in automation teams: they treat performance as a separate ceremony that happens late in the release. A QA engineer validates flows with Playwright. Another team runs load tests once a sprint. Nobody catches the login page that quietly moved from 1.8 seconds to 5.6 seconds after a new analytics script.
That gap is where Playwright performance testing helps. It does not prove that your platform handles 20,000 concurrent users. It proves that the single-user journey did not become slower, heavier, or noisier than the budget your team agreed to.
The timing is right because Playwright is already part of many QA pipelines. The GitHub API for microsoft/playwright showed 94,219 stars during research for this article, and the npm downloads API for @playwright/test reported 208,655,630 downloads for the last-month window ending 2026-08-06. Those numbers do not make a tool perfect, but they explain why SDETs can add practical checks without asking for a new platform first.
What Playwright can measure well
Use Playwright for performance checks that live close to real user flows. The browser has access to navigation timing, resource timing, console messages, request durations, response status codes, and screenshots. Playwright also gives you traces, videos, and HTML reports that are easy to attach to a defect.
- Navigation time for important pages like login, search, checkout, and reports.
- API response time for calls made during a user journey.
- Resource count and size for JavaScript, CSS, images, fonts, and third-party scripts.
- Basic web vital style signals collected from the browser.
- Regression evidence through trace files and screenshots.
What Playwright should not pretend to measure
Do not sell this as load testing. A Playwright browser session is expensive compared with protocol-level load tools. Running 500 browsers to simulate traffic is usually wasteful, unstable, and hard to analyze. If you need sustained load, use a load tool and feed the result into your release gate separately.
The clean model is simple: Playwright checks the customer journey budget. Load tools check system behavior under volume. Observability checks production and staging telemetry. These three layers support each other.
Playwright performance testing setup
Playwright performance testing needs a boring setup. Boring is good here. Your test should run against a predictable environment, collect the same metrics every time, and avoid failing on one noisy sample. I prefer a separate performance project in playwright.config.ts so the checks do not slow every PR run.
Start with a dedicated folder:
mkdir -p tests/performance
npm init playwright@latest
npm install -D @playwright/test
If you already followed earlier days in this series, keep your existing repo. You can connect this tutorial with the contract checks from Playwright Contract Testing with TypeScript and the data isolation ideas from Playwright Test Data Management with TypeScript.
Configuration for stable timing checks
Playwright’s official timeout documentation says the default test timeout is 30,000 ms in Playwright Test. That is useful for avoiding stuck tests, but it is not a performance budget. A timeout means the test is dead. A budget means the feature is slower than your release standard. Keep those two concepts separate.
// playwright.config.ts
import { defineConfig, devices } from '@playwright/test';

export default defineConfig({
  testDir: './tests',
  timeout: 60_000,
  retries: process.env.CI ? 1 : 0,
  reporter: [
    ['html', { outputFolder: 'playwright-report' }],
    ['json', { outputFile: 'test-results/results.json' }]
  ],
  use: {
    baseURL: process.env.BASE_URL ?? 'https://example.com',
    trace: 'retain-on-failure',
    screenshot: 'only-on-failure',
    video: 'retain-on-failure'
  },
  projects: [
    {
      name: 'performance-chromium',
      testMatch: /.*\.perf\.spec\.ts/,
      use: { ...devices['Desktop Chrome'] }
    }
  ]
});
Create a budget file
Hardcoding numbers inside tests becomes messy after two weeks. Put budgets in one TypeScript object. The budget should be strict enough to catch regressions but not so strict that CI becomes a random failure generator.
// tests/performance/budgets.ts
export type PageBudget = {
  path: string;
  maxLoadMs: number;
  maxDomContentLoadedMs: number;
  maxJsResources: number;
  maxTotalResources: number;
};

export const pageBudgets: Record = {
  login: {
    path: '/login',
    maxLoadMs: 3500,
    maxDomContentLoadedMs: 2000,
    maxJsResources: 18,
    maxTotalResources: 65
  },
  dashboard: {
    path: '/dashboard',
    maxLoadMs: 4500,
    maxDomContentLoadedMs: 2600,
    maxJsResources: 28,
    maxTotalResources: 90
  }
}; The first useful check is navigation timing. The browser exposes a PerformanceNavigationTiming entry after a page load. From that entry, you can calculate DOMContentLoaded, load event time, response time, and other browser-level signals.
Here is a helper I use as a starting point:
// tests/performance/perf-helpers.ts
import { Page, expect, test } from '@playwright/test';

export type NavigationMetrics = {
  domContentLoadedMs: number;
  loadMs: number;
  responseStartMs: number;
  transferSize: number;
  resources: {
    total: number;
    scripts: number;
    stylesheets: number;
    images: number;
  };
};

export async function collectNavigationMetrics(page: Page): Promise<NavigationMetrics> {
  return await page.evaluate(() => {
    const nav = performance.getEntriesByType('navigation')[0] as PerformanceNavigationTiming;
    const resources = performance.getEntriesByType('resource') as PerformanceResourceTiming[];

    return {
      domContentLoadedMs: Math.round(nav.domContentLoadedEventEnd - nav.startTime),
      loadMs: Math.round(nav.loadEventEnd - nav.startTime),
      responseStartMs: Math.round(nav.responseStart - nav.startTime),
      transferSize: nav.transferSize ?? 0,
      resources: {
        total: resources.length,
        scripts: resources.filter(r => r.initiatorType === 'script').length,
        stylesheets: resources.filter(r => r.initiatorType === 'link' || r.initiatorType === 'css').length,
        images: resources.filter(r => r.initiatorType === 'img').length
      }
    };
  });
}

export async function attachMetrics(name: string, metrics: unknown) {
  await test.info().attach(name, {
    body: JSON.stringify(metrics, null, 2),
    contentType: 'application/json'
  });
}
Write the first page budget test
The test should be readable to a QA lead during a release review. Avoid clever abstractions in the first version. You can refactor after two or three pages are stable.
// tests/performance/dashboard.perf.spec.ts
import { test, expect } from '@playwright/test';
import { pageBudgets } from './budgets';
import { attachMetrics, collectNavigationMetrics } from './perf-helpers';

test.describe('dashboard performance budget', () => {
  test('dashboard stays inside agreed browser budget', async ({ page }) => {
    const budget = pageBudgets.dashboard;

    await page.goto(budget.path, { waitUntil: 'load' });
    await expect(page.getByRole('heading', { name: /dashboard/i })).toBeVisible();

    const metrics = await collectNavigationMetrics(page);
    await attachMetrics('dashboard-performance.json', metrics);

    expect(metrics.domContentLoadedMs, 'DOMContentLoaded budget').toBeLessThanOrEqual(
      budget.maxDomContentLoadedMs
    );
    expect(metrics.loadMs, 'full load budget').toBeLessThanOrEqual(budget.maxLoadMs);
    expect(metrics.resources.scripts, 'JavaScript resource budget').toBeLessThanOrEqual(
      budget.maxJsResources
    );
    expect(metrics.resources.total, 'total resource budget').toBeLessThanOrEqual(
      budget.maxTotalResources
    );
  });
});
Add a simple web vital collector
For production-grade Core Web Vitals, use a proper RUM setup. For pre-release checks, you can still capture useful signals in a controlled browser run. Keep the claim modest: this is a synthetic signal, not your real customer population.
export async function collectPaintMetrics(page: Page) {
  return await page.evaluate(() => {
    const paints = performance.getEntriesByType('paint');
    const getPaint = (name: string) =>
      Math.round(paints.find(entry => entry.name === name)?.startTime ?? 0);

    return {
      firstPaintMs: getPaint('first-paint'),
      firstContentfulPaintMs: getPaint('first-contentful-paint')
    };
  });
}
Screenshot description: capture the Playwright HTML report after this run. The first screenshot should show a green performance test with an attached dashboard-performance.json file. The second screenshot should show the JSON attachment with loadMs, domContentLoadedMs, and resource counts.
API and network performance checks
Most modern page delays come from network calls, not only from the initial document. Playwright gives you request and response events, so you can collect timings around the API calls that matter. This is useful when the UI waits for search, pricing, inventory, reports, or permissions.
The official Playwright documentation has dedicated guides for API testing and network handling. I like using both ideas together: APIRequestContext for direct service checks, and page network events for user-flow checks.
Track slow responses during a page flow
// tests/performance/network-listener.ts
import { Page } from '@playwright/test';

export type ApiTiming = {
  url: string;
  method: string;
  status: number;
  durationMs: number;
};

export function trackApiTimings(page: Page, urlPattern = /\/api\//) {
  const started = new Map<string, number>();
  const timings: ApiTiming[] = [];

  page.on('request', request => {
    if (urlPattern.test(request.url())) {
      started.set(request.url(), Date.now());
    }
  });

  page.on('response', response => {
    const request = response.request();
    const start = started.get(response.url());
    if (start && urlPattern.test(response.url())) {
      timings.push({
        url: response.url(),
        method: request.method(),
        status: response.status(),
        durationMs: Date.now() - start
      });
    }
  });

  return timings;
}
Fail on important slow calls, not every call
Do not fail a release because a non-critical analytics call took 900 ms. Filter for calls that block the user journey. For example, search results, account summary, cart pricing, and order submission deserve budgets. A heatmap pixel does not.
import { test, expect } from '@playwright/test';
import { trackApiTimings } from './network-listener';

test('search API stays inside the user-flow budget', async ({ page }) => {
  const apiTimings = trackApiTimings(page, /\/api\/search/);

  await page.goto('/products');
  await page.getByRole('searchbox', { name: /search/i }).fill('wireless keyboard');
  await page.keyboard.press('Enter');
  await expect(page.getByTestId('search-results')).toBeVisible();

  const slowCalls = apiTimings.filter(call => call.durationMs > 1200);
  await test.info().attach('search-api-timings.json', {
    body: JSON.stringify(apiTimings, null, 2),
    contentType: 'application/json'
  });

  expect(slowCalls, 'search calls slower than 1200 ms').toEqual([]);
});
Use APIRequestContext for direct checks
Sometimes the page is not needed. A direct API timing check is faster and less flaky. It also pairs well with the contract testing workflow from Day 46.
import { test, expect } from '@playwright/test';

test('pricing API responds within budget', async ({ request }) => {
  const start = performance.now();
  const response = await request.get('/api/pricing?sku=SKU-123');
  const durationMs = Math.round(performance.now() - start);

  expect(response.status()).toBe(200);
  expect(durationMs, 'pricing API duration').toBeLessThanOrEqual(700);

  await test.info().attach('pricing-api-performance.json', {
    body: JSON.stringify({ status: response.status(), durationMs }, null, 2),
    contentType: 'application/json'
  });
});
CI gates, traces, and reports
A performance check is only useful when it produces evidence. Playwright’s trace viewer is one of the best debugging tools in the ecosystem. The official trace viewer docs describe it as a GUI for exploring recorded traces after a script has run, and it is especially useful for CI failures. Use that.
The latest Playwright release from the GitHub releases API during research was v1.62.1, published on 2026-07-30. Pin your version in CI and upgrade intentionally. Performance budgets are sensitive to browser changes, so accidental tool upgrades create noisy data.
Run only performance specs in CI
# .github/workflows/playwright-performance.yml
name: Playwright Performance Budgets

on:
  pull_request:
    branches: [main]
  workflow_dispatch:

jobs:
  performance:
    runs-on: ubuntu-latest
    steps:
      - uses: actions/checkout@v4
      - uses: actions/setup-node@v4
        with:
          node-version: 22
          cache: 'npm'
      - run: npm ci
      - run: npx playwright install --with-deps chromium
      - name: Run performance specs
        run: npx playwright test --project=performance-chromium
        env:
          BASE_URL: ${{ secrets.STAGING_BASE_URL }}
      - uses: actions/upload-artifact@v4
        if: always()
        with:
          name: playwright-performance-report
          path: |
            playwright-report
            test-results
Use a three-run median for noisy pages
One run is often enough for smoke-level checks. For pages with known variance, run the measurement three times and assert on the median. This reduces false failures without hiding real regressions.
function median(values: number[]) {
  const sorted = [...values].sort((a, b) => a - b);
  return sorted[Math.floor(sorted.length / 2)];
}

test('login page median load time stays inside budget', async ({ page }) => {
  const loads: number[] = [];

  for (let i = 0; i < 3; i++) {
    await page.goto('/login', { waitUntil: 'load' });
    const metrics = await collectNavigationMetrics(page);
    loads.push(metrics.loadMs);
    await page.context().clearCookies();
  }

  await test.info().attach('login-load-samples.json', {
    body: JSON.stringify({ loads, medianLoadMs: median(loads) }, null, 2),
    contentType: 'application/json'
  });

  expect(median(loads)).toBeLessThanOrEqual(3500);
});
Version the budget like product code
If the team agrees to raise a budget, make that change visible in code review. The pull request should answer three questions:
- What changed in the product or architecture?
- Which user journey became slower or heavier?
- What evidence proves the new budget is acceptable?
This is where QA gets stronger. Instead of saying, “the page feels slow,” you bring a trace, a JSON attachment, a failing budget, and a diff.
Common pitfalls
Performance checks fail for bad reasons when teams skip the basics. I would rather have five stable budgets than 40 impressive tests that fail randomly every morning.
Pitfall 1: using production as the only benchmark
Production gives the most realistic signal, but it is not always safe for CI. Use staging for release gates and production monitoring for real-user trends. If production has a CDN, bot controls, different data, or regional routing, document that difference.
Pitfall 2: testing with dirty data
A dashboard with 15 widgets and a dashboard with 1,500 widgets are different products from a performance angle. Seed known test data. If you need help, revisit the data patterns from Day 45.
Pitfall 3: mixing assertion timeout with performance budget
Playwright assertions wait for conditions. That is helpful for UI stability, but it can hide a slow experience if the timeout is too generous. If a page takes 9 seconds and your assertion timeout is 10 seconds, the test passes while the user suffers. Measure time directly.
Pitfall 4: failing on third-party noise
Marketing pixels, chat widgets, and analytics endpoints can vary. Track them, but do not let them own your release gate unless they block the actual user journey. Use allowlists and critical endpoint lists.
Pitfall 5: no screenshot description in the defect
A good defect has evidence. Add this screenshot description to your bug template: “Playwright HTML report showing failed performance budget, JSON attachment with loadMs and API timings, trace viewer opened on the slow action, and network waterfall highlighting the delayed request.” That is easier for developers to act on than a vague complaint.
India team context
For Indian QA teams, this skill has direct career value. Service company teams often get handed late-cycle regression work. Product company SDET teams are expected to protect release quality with CI evidence. Playwright performance testing sits in the second bucket because it connects automation, browser internals, CI, and engineering judgment.
If you are aiming for stronger SDET roles in Bengaluru, Pune, Hyderabad, Chennai, or remote product teams, do not present this as “I know Playwright.” Present it as:
- “I built Playwright performance budgets for critical flows.”
- “I attached trace and JSON evidence to every failed budget.”
- “I separated page budgets from load testing and production monitoring.”
- “I reduced noisy performance failures by using median samples and stable data.”
That sounds like ownership. It also creates better interview stories than another basic login test. If you are building a broader Playwright roadmap, also read BrowserStack Cloud Grid Integration with Playwright and GitLab CI for Playwright: Complete Pipeline Guide.
Key takeaways
Playwright performance testing gives SDETs a practical release gate for browser journeys. Keep it focused, measurable, and evidence-heavy.
- Use Playwright for single-user journey budgets, not fake load testing.
- Store budgets in code and review budget changes like product changes.
- Collect navigation timing, resource counts, paint signals, and API timings.
- Attach JSON metrics, screenshots, traces, and HTML reports to failures.
- Run performance specs separately in CI so the main regression suite stays fast.
The win is not a fancy dashboard. The win is catching a slow login, search, checkout, or dashboard before a customer or release manager finds it.
FAQ
Is Playwright performance testing enough for load testing?
No. Use Playwright for browser journey budgets. Use load testing tools for concurrency, throughput, soak tests, and system limits. Do not confuse one browser flow with platform capacity.
Should I fail the build on every slow API call?
No. Fail the build only on critical calls that block the user journey. Track non-critical calls as evidence, but avoid noisy release gates.
How many samples should I run?
Start with one sample for stable pages. Use three samples and assert on the median for pages with known variance. If you need more than five samples to get a stable signal, the environment is probably not ready for a hard gate.
Can I use this with BrowserStack or other cloud grids?
Yes, but keep separate budgets for local CI and cloud browsers. Network path, browser startup, and grid load can change timing. The same thresholds rarely work everywhere.
What should I show in a demo?
Show one passing run, one intentional failing budget, the JSON attachment, the trace viewer, and the CI artifact. That tells the full story in five minutes.