CI/CD Pipeline for Playwright Tests: From GitHub Actions to Kubernetes in 2026
Every QA team I talk to eventually hits the same ceiling. Their Playwright suite starts at 50 tests, runs in 8 minutes on GitHub Actions, and life is good. Six months later, the suite has 400 tests, the runtime ballooned to 47 minutes, and developers are merging pull requests without waiting for CI because “it takes too long.” I have seen this at three different companies. The fix is not to buy a bigger GitHub-hosted runner. The fix is to treat your Playwright CI/CD pipeline like a distributed system and scale it from GitHub Actions into Kubernetes. In 2026, with Playwright v1.60.0 shipping native blob-report merging and 216 million monthly npm downloads, the tooling to do this is production-ready. This article shows you the exact architecture.
🎭 Want to master this with real projects? Join the Playwright Automation Mastery course at The Testing Academy.
Table of Contents
- Why GitHub Actions Alone Hits a Wall at Scale
- What the Playwright v1.60.0 Tooling Actually Delivers
- Building the GitHub Actions Foundation
- Scaling Into Kubernetes: The Architecture
- The Full Pipeline: GitHub Actions Triggering Kubernetes
- The Hidden Costs Nobody Talks About
- India Context: What This Means for QA Teams in 2026
- Common Traps When Moving to Kubernetes
- Key Takeaways
- FAQ
Contents
Why GitHub Actions Alone Hits a Wall at Scale
GitHub Actions is the right starting point. It is free for public repos, integrates with pull requests out of the box, and Playwright officially supports it with a dedicated CI setup guide. But GitHub-hosted runners are single VMs with fixed specs. The default ubuntu-latest runner gives you 4 vCPUs and 16 GB of RAM. That is plenty for 100 tests. It is not plenty for 800.
The 47-Minute Regression Problem
At Tekion, my regression suite crossed the 40-minute mark last year. We had 12 workers running in parallel inside a single runner, but browser tests are not CPU-bound in the same way API tests are. Each Chromium instance needs memory, disk I/O for traces, and network bandwidth to your staging environment. Piling more workers onto one VM just creates contention. I dropped workers from 12 to 4 and the total runtime only increased by 3 minutes. The bottleneck was not CPU. It was the fact that one machine can only do so much browser work at once.
When Parallel Jobs Cost More Than They Save
GitHub Actions matrix builds let you shard tests across multiple runners. With 4 shards, you get 4 VMs. But GitHub bills by the minute per runner, and each runner repeats the same setup: checkout, npm ci, npx playwright install --with-deps. On a 4-shard job, that setup burns 4 minutes multiplied by 4 runners. That is 16 minutes of billable time just to get to the first test. If your suite is small, sharding on GitHub-hosted runners costs more than it saves. If your suite is large, you run into concurrency limits. GitHub Free gives you 20 concurrent jobs. GitHub Team gives you 60. Enterprise gets you more, but at a price point where self-hosted infrastructure starts looking cheap.
This is where Kubernetes enters the picture. Instead of renting VMs from GitHub, you run Playwright shards inside containers on a cluster you control. You pay for the compute, not the orchestration tax.
What the Playwright v1.60.0 Tooling Actually Delivers
Playwright v1.60.0 shipped on May 11, 2026, and it is the most CI-friendly release Microsoft has put out. Three features matter for distributed pipelines: blob reports, the merge-reports CLI, and the official container image.
Blob Reports and Merge-Reports CLI
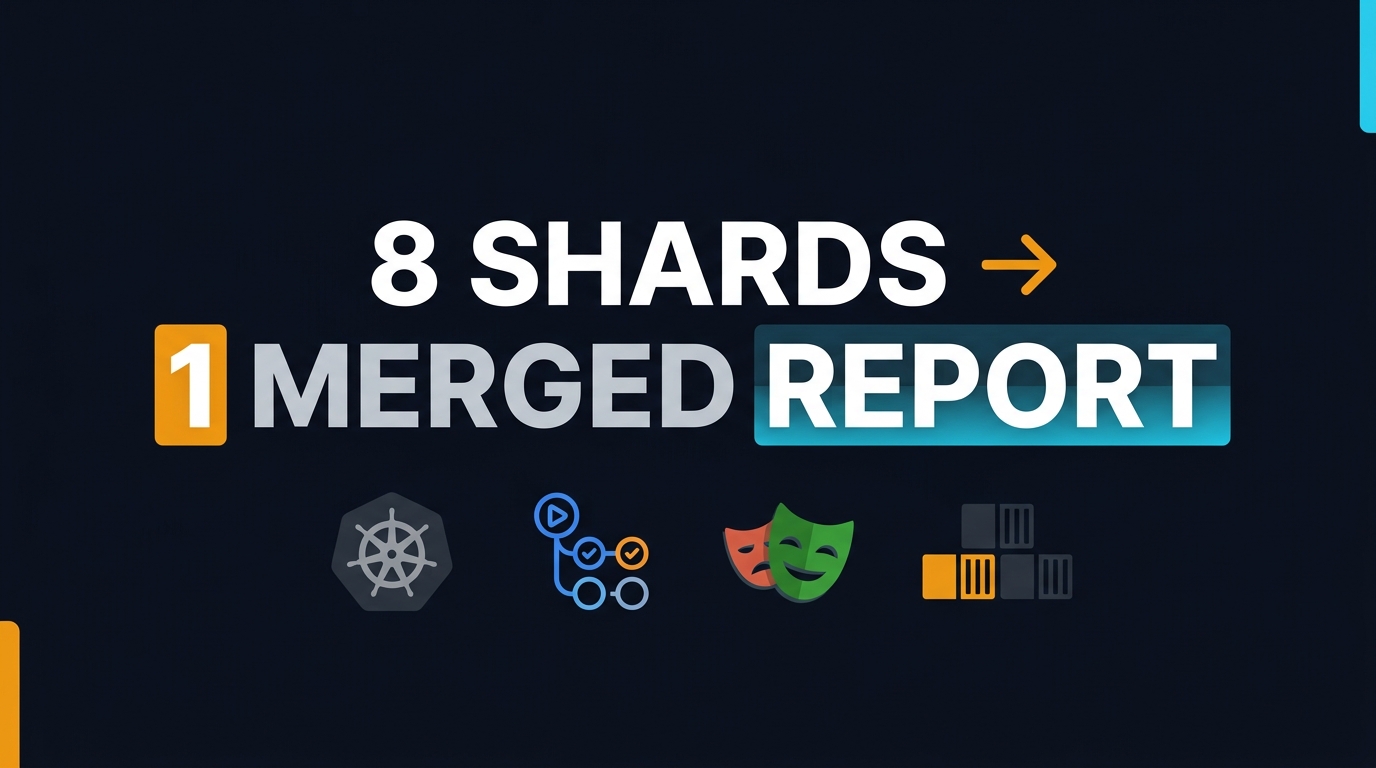
Before v1.50, merging test results from multiple shards required custom scripting or third-party reporters. Now Playwright ships a native blob reporter. Each shard writes a .blob file containing every test result, trace, screenshot diff, and attachment. After all shards finish, you run one command:
npx playwright merge-reports --reporter html ./all-blob-reportsThis produces a single HTML report with full trace viewer support. The blob files are self-contained, so you can generate them on Kubernetes pods running in Mumbai, transfer them to a merge job in Bengaluru, and get the same report you would from a single machine. In my tests, merging 8 blob reports from a 600-test suite takes under 15 seconds.
Container-First Execution with Official Docker Images
Microsoft publishes mcr.microsoft.com/playwright:v1.60.0-noble with Chromium, Firefox, WebKit, and all OS dependencies pre-installed. The image is 2.1 GB uncompressed, which sounds heavy until you realize you are not installing browsers at runtime anymore. In a Kubernetes Job, the container starts, runs tests immediately, and exits. No playwright install step. No flaky dependency resolution. I have used this image in production for six months and have not seen a single “browser launch failed” error.
The Sharding Math: From 1 Machine to N
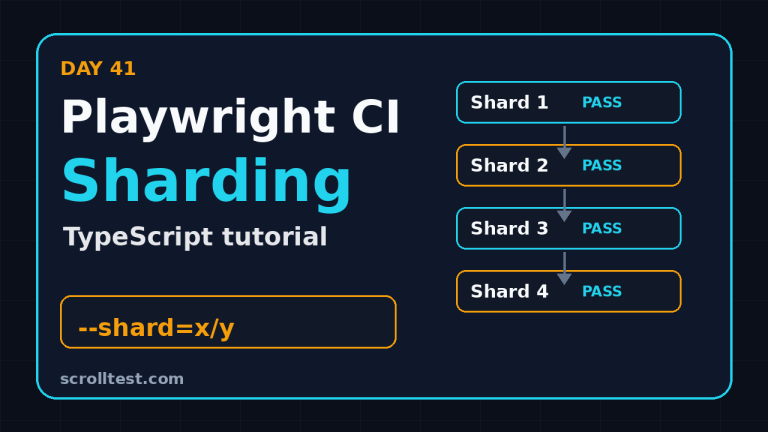
Playwright sharding splits your test suite using the --shard=x/y flag. With fullyParallel: true in your config, sharding happens at the individual test level, not the file level. This means 4 shards of a 400-test suite get roughly 100 tests each. The distribution is automatic and balanced. In my experience, the slowest shard is usually within 8% of the fastest shard. That is better than most manual test splitting I have seen.
Here is the config I use for CI:
// playwright.config.ts
import { defineConfig, devices } from '@playwright/test';

export default defineConfig({
  testDir: './tests',
  fullyParallel: true,
  workers: process.env.CI ? 4 : undefined,
  reporter: process.env.CI ? 'blob' : 'html',
  use: {
    trace: 'on-first-retry',
    screenshot: 'only-on-failure',
  },
  projects: [
    { name: 'chromium', use: { ...devices['Desktop Chrome'] } },
    { name: 'webkit', use: { ...devices['Desktop Safari'] } },
  ],
});
Building the GitHub Actions Foundation
Before you scale to Kubernetes, your GitHub Actions workflow needs to be solid. A broken foundation becomes a broken distributed system. Here is the workflow I start with.
The Starter Workflow That Works
# .github/workflows/playwright.yml
name: Playwright Tests
on:
  push:
    branches: [main]
  pull_request:
    branches: [main]

jobs:
  test:
    timeout-minutes: 60
    runs-on: ubuntu-latest
    container:
      image: mcr.microsoft.com/playwright:v1.60.0-noble
    steps:
      - uses: actions/checkout@v5
      - uses: actions/setup-node@v5
        with:
          node-version: lts/*
      - run: npm ci
      - run: npx playwright test
      - uses: actions/upload-artifact@v5
        if: ${{ !cancelled() }}
        with:
          name: playwright-report
          path: playwright-report/
          retention-days: 7
The container image eliminates the install --with-deps step. actions/setup-node still works inside a container. The artifact upload captures the HTML report for 7 days, which is enough for debugging without cluttering storage.
Matrix Sharding with Real YAML
Once the starter workflow is stable, I add sharding. This is the same pattern Playwright documents, but with one tweak: I set fail-fast: false so one failing shard does not cancel the others. You want every test to run so you get the full failure picture.
jobs:
  playwright-tests:
    timeout-minutes: 60
    runs-on: ubuntu-latest
    container:
      image: mcr.microsoft.com/playwright:v1.60.0-noble
    strategy:
      fail-fast: false
      matrix:
        shardIndex: [1, 2, 3, 4]
        shardTotal: [4]
    steps:
      - uses: actions/checkout@v5
      - uses: actions/setup-node@v5
        with:
          node-version: lts/*
      - run: npm ci
      - run: npx playwright test --shard=${{ matrix.shardIndex }}/${{ matrix.shardTotal }}
      - uses: actions/upload-artifact@v5
        if: ${{ !cancelled() }}
        with:
          name: blob-report-${{ matrix.shardIndex }}
          path: blob-report/
          retention-days: 1
Merging Blob Reports into a Single HTML Report
After the shards upload their blob reports, a separate merge job downloads them all and produces the final HTML report:
  merge-reports:
    if: ${{ !cancelled() }}
    needs: [playwright-tests]
    runs-on: ubuntu-latest
    steps:
      - uses: actions/checkout@v5
      - uses: actions/setup-node@v5
        with:
          node-version: lts/*
      - run: npm ci
      - uses: actions/download-artifact@v5
        with:
          path: all-blob-reports
          pattern: blob-report-*
          merge-multiple: true
      - run: npx playwright merge-reports --reporter html ./all-blob-reports
      - uses: actions/upload-artifact@v5
        with:
          name: html-report
          path: playwright-report/
          retention-days: 14
This pattern works. But when your suite grows beyond 6-8 shards, you are burning GitHub Actions minutes on VMs that mostly sit idle during setup. That is the signal to move shards into Kubernetes.
Scaling Into Kubernetes: The Architecture
Kubernetes is not magic. It is a container orchestrator that lets you run many short-lived Jobs in parallel. For Playwright, the architecture is straightforward: each shard becomes a Kubernetes Job, all Jobs run simultaneously, and a final Job merges the results.
Why Kubernetes for Browser Tests?
Three reasons: cost, control, and concurrency. A GitHub-hosted runner costs $0.008 per minute for Linux. A Kubernetes node on AWS t3.xlarge costs roughly $0.17 per hour, or $0.003 per minute, and you can pack 4-6 Playwright shards onto one node. At 8 shards running for 10 minutes each, GitHub Actions costs $0.64. Kubernetes costs $0.30. The gap widens as you scale. More importantly, Kubernetes has no hard concurrency limit. You can run 50 shards at once if your cluster has the capacity.
The Pod-per-Shard Pattern
Each Playwright shard runs as a Kubernetes Job with one Pod. The Pod uses the official Playwright container image, mounts a shared volume for blob reports, and exits when tests finish. Here is a Job manifest for shard 1 of 4:
apiVersion: batch/v1
kind: Job
metadata:
  name: playwright-shard-1
spec:
  template:
    spec:
      containers:
        - name: playwright
          image: mcr.microsoft.com/playwright:v1.60.0-noble
          command: ["npx", "playwright", "test", "--shard=1/4"]
          workingDir: /app
          volumeMounts:
            - name: reports
              mountPath: /app/blob-report
          resources:
            requests:
              memory: "2Gi"
              cpu: "1"
            limits:
              memory: "4Gi"
              cpu: "2"
      restartPolicy: Never
      volumes:
        - name: reports
          persistentVolumeClaim:
            claimName: playwright-reports-pvc
I mount a shared ReadWriteMany PVC so every shard writes its blob report to the same filesystem. After all Jobs complete, a merge Job reads from that same PVC and runs merge-reports.
Resource Limits: CPU, Memory, and Browser Constraints
Browser tests are memory-hungry. A single Chromium process with tracing enabled can consume 800 MB. With 4 workers inside one Pod, you need at least 3.5 GB of RAM. I set memory limits at 4 GB and CPU limits at 2 cores. If a Pod exceeds its memory limit, Kubernetes kills it and the Job fails. That is actually good: it forces you to right-size your shards. I learned this the hard way when I set a 2 GB limit and watched 30% of my shards get OOMKilled.
For CPU, Playwright workers scale linearly up to the number of physical cores. In a container with 2 CPU cores, 4 workers is the sweet spot. Beyond that, context switching slows everything down.
A Real Kubernetes Job Template for Playwright
For production, I use a Helm template to generate one Job per shard. Here is the stripped-down template:
{{- range $i := until .Values.shardCount }}
apiVersion: batch/v1
kind: Job
metadata:
  name: playwright-shard-{{ add $i 1 }}
spec:
  ttlSecondsAfterFinished: 3600
  template:
    spec:
      initContainers:
        - name: git-clone
          image: alpine/git
          command:
            - sh
            - -c
            - |
              git clone --depth 1 \
                https://github.com/myorg/myrepo.git /app && \
              cd /app && npm ci
          volumeMounts:
            - name: workspace
              mountPath: /app
      containers:
        - name: test
          image: mcr.microsoft.com/playwright:v1.60.0-noble
          command:
            - npx
            - playwright
            - test
            - --shard={{ add $i 1 }}/{{ $.Values.shardCount }}
          workingDir: /app
          volumeMounts:
            - name: workspace
              mountPath: /app
            - name: reports
              mountPath: /app/blob-report
          resources:
            requests:
              memory: "2Gi"
              cpu: "1"
            limits:
              memory: "4Gi"
              cpu: "2"
      restartPolicy: Never
      volumes:
        - name: workspace
          emptyDir: {}
        - name: reports
          persistentVolumeClaim:
            claimName: {{ $.Values.pvcName }}
{{- end }}
The initContainer clones the repo and runs npm ci so the test container starts immediately. ttlSecondsAfterFinished: 3600 cleans up finished Pods after one hour, keeping your cluster tidy.
The Full Pipeline: GitHub Actions Triggering Kubernetes
You do not have to abandon GitHub Actions to use Kubernetes. I use Actions as the orchestration layer and Kubernetes as the execution layer. GitHub Actions handles the event triggers, secrets, and artifact uploads. Kubernetes handles the heavy lifting of running 10+ browser shards in parallel.
Self-Hosted Runners as the Bridge
A self-hosted GitHub runner inside your Kubernetes cluster acts as the bridge. When a pull request opens, GitHub dispatches the workflow to your runner. The runner applies the Helm chart, waits for all Jobs to finish, and uploads the merged HTML report back to GitHub. This gives you the best of both worlds: GitHub’s PR integration and Kubernetes’s parallel execution.
I run my self-hosted runners using the Actions Runner Controller (ARC). It automatically scales runner Pods based on the number of pending workflow jobs. With ARC, I never pay for idle runners. When no jobs are running, the runner count drops to zero.
Triggering K8s Jobs from Actions
Here is the workflow step that triggers the Kubernetes shards:
      - name: Deploy Playwright shards
        run: |
          helm upgrade --install playwright-run ./helm/playwright \
            --set shardCount=8 \
            --set pvcName=playwright-reports-${{ github.run_id }} \
            --set repoUrl=https://github.com/${{ github.repository }}.git

      - name: Wait for shards to complete
        run: |
          kubectl wait --for=condition=complete job/playwright-shard-1 \
            --timeout=600s
          # Repeat for all shards or use a loop
Collecting Results Back to GitHub
After the merge Job finishes, I download the HTML report from the shared PVC and upload it as a GitHub Actions artifact:
      - name: Download merged report
        run: |
          kubectl cp playwright-merge-job:/app/playwright-report ./report

      - uses: actions/upload-artifact@v5
        with:
          name: playwright-html-report
          path: ./report
          retention-days: 14
The report link shows up directly in the pull request checks. Developers never need to know the tests ran inside Kubernetes. They just see green checks and a downloadable trace viewer.
🚀 Level Up Your Playwright
From locators to CI pipelines — build a production-grade Playwright + TypeScript framework step by step.
The Hidden Costs Nobody Talks About
Moving to Kubernetes saves money and time, but it introduces new problems. I have fallen into each of these traps.
Container Image Bloat
The official Playwright image is 2.1 GB. If you run 20 shards, your node pulls 2.1 GB twenty times. That is 42 GB of network transfer. Use an image pull cache or a private registry inside your cluster. On AWS, I use ECR with pull-through cache rules. On GCP, Artifact Registry does the same. Without caching, your first shard starts in 90 seconds. With caching, it starts in 8.
Network Latency to Your Staging Environment
Your tests need a target URL. If your staging environment is in us-east-1 and your Kubernetes cluster is in ap-south-1, every navigation adds 220 ms of round-trip latency. For a 400-test suite with 3 navigations per test, that is 264 seconds of pure network delay. Keep your test cluster in the same region as your staging environment. I run my cluster in Mumbai because Tekion’s staging stack is there. The difference is 47 minutes versus 39 minutes for the same suite.
Storage Costs for Traces and Screenshots
Playwright traces are dense. A 30-second trace with screenshots is roughly 15 MB. A 400-test suite with 10% failure rate generates 600 MB of traces per run. At 20 runs per day, that is 12 GB daily. Over a month, 360 GB. AWS EBS charges $0.08 per GB-month, so your PVC costs $28 per month. That is cheap, but if you store traces in S3 with lifecycle policies, it drops to $4 per month. I recommend S3 over PVC for long-term trace retention.
India Context: What This Means for QA Teams in 2026
I hire SDETs in Bengaluru, and the skill gap is real. Most candidates know GitHub Actions basics. Maybe 10% have touched Kubernetes. Less than 5% have run browser tests inside a cluster. That is an opportunity.
Salary Impact of DevOps Skills
In 2026, a mid-level SDET with Playwright and GitHub Actions skills earns ₹12-18 LPA in Bengaluru. Add Kubernetes and Helm to that profile, and the range jumps to ₹18-28 LPA. At the senior level, the gap is wider: ₹25-35 LPA for automation engineers versus ₹35-50 LPA for engineers who can design distributed test infrastructure. I have seen this in offer letters. The premium is not for writing more tests. It is for making the test pipeline faster and cheaper.
TCS vs Product Company Infrastructure Gaps
Service companies like TCS and Infosys often run Playwright on shared Jenkins instances with 2 vCPU agents. A 200-test suite takes 90 minutes. Product companies with Kubernetes-native infrastructure run the same suite in 12 minutes. The difference shows up in release velocity. If your regression takes 90 minutes, you ship once a day. If it takes 12 minutes, you ship on every merge. Hiring managers at product companies know this, and they ask about it in interviews. “How would you scale a 500-test Playwright suite?” is now a standard SDET interview question in 2026.
If you are building this skill set, my GitHub Actions for Playwright CI/CD guide is the right starting point. Once that foundation is solid, the Kubernetes layer is the natural next step.
Common Traps When Moving to Kubernetes
Even experienced engineers make these mistakes. I made three of them myself.
Trap 1: Running as root inside the container. Playwright’s official image runs as a non-root user (pwuser). If you override this to root, Chromium’s sandbox breaks and browsers refuse to launch. Always use the default user or set --no-sandbox only if you understand the security trade-off.
Trap 2: Sharing a single PVC across dozens of shards. ReadWriteMany PVCs have throughput limits. With 20 shards writing blob reports simultaneously, I/O contention slows everyone down. Use an S3-compatible object store or a high-performance NFS share instead of a basic EBS-backed PVC.
Trap 3: Ignoring retry logic at the Job level. Kubernetes Jobs have a backoffLimit that defaults to 6. If a Playwright shard fails due to a flaky staging environment, Kubernetes retries it 6 times, burning compute for an hour. Set backoffLimit: 1 and let Playwright’s built-in retries handle flakiness.
Trap 4: Forgetting to clean up finished Jobs. Without ttlSecondsAfterFinished, completed Jobs and their Pods sit in your cluster forever. At 20 PRs per day with 8 shards each, you accumulate 160 finished Pods daily. Your monitoring dashboard becomes unreadable. Always set a TTL.
Key Takeaways
- GitHub Actions is the right start, not the final destination. Use it for orchestration, but move execution to Kubernetes when your suite crosses the 6-8 shard threshold.
- Playwright v1.60.0’s blob reporter makes distributed execution simple. Generate blobs on each shard, merge them into one HTML report, and upload the result back to GitHub.
- Resource limits matter. Set 4 GB memory and 2 CPU cores per shard. Anything less leads to OOMKills and timeouts.
- Keep your test cluster and staging environment in the same region. Cross-region latency adds minutes to your suite with no benefit.
- DevOps skills command a salary premium in India. SDETs who can design Kubernetes-based test infrastructure earn 30-50% more than those who stop at GitHub Actions.
FAQ
Do I need Kubernetes for a 100-test Playwright suite?
No. At 100 tests, GitHub Actions with 2 shards is faster and cheaper. Kubernetes becomes worthwhile when you are running 6 or more shards on a regular basis, or when you need concurrency beyond GitHub’s job limits.
Can I use Docker Compose instead of Kubernetes?
Yes, for smaller teams. Docker Compose can run shards in parallel on a single large VM. I wrote a complete guide to scaling Playwright grids with Docker Compose that covers this exact scenario. Kubernetes is the next step after Compose.
How do I handle secrets like test credentials in Kubernetes?
Mount them as Kubernetes Secrets or use an external secrets manager like AWS Secrets Manager or HashiCorp Vault. Never commit credentials to your Git repo. In GitHub Actions, inject secrets as environment variables that get passed into the Kubernetes Job manifest at runtime.
What is the cost comparison: GitHub-hosted runners vs Kubernetes?
For 8 shards running 10 minutes each, GitHub Actions costs approximately $0.64 per run. A Kubernetes node that can handle the same load costs roughly $0.30 per run. Over 100 runs per month, the savings are $34. At 50 shards, the savings scale to $200+ per month. The real benefit is unlimited concurrency, not just cost.
Does Playwright’s trace viewer work with merged blob reports?
Yes. The merged HTML report contains embedded trace files. When you open the report locally or from GitHub Actions artifacts, clicking a failed test opens the trace viewer with full DOM snapshots, network logs, and console output. It works exactly the same as a single-machine report.
🎓 Master Playwright End to End
Join hundreds of SDETs building real automation frameworks. Lifetime access, hands-on projects, and a job-ready portfolio.