
Playwright Custom Reporter: Slack Alerts in TypeScript
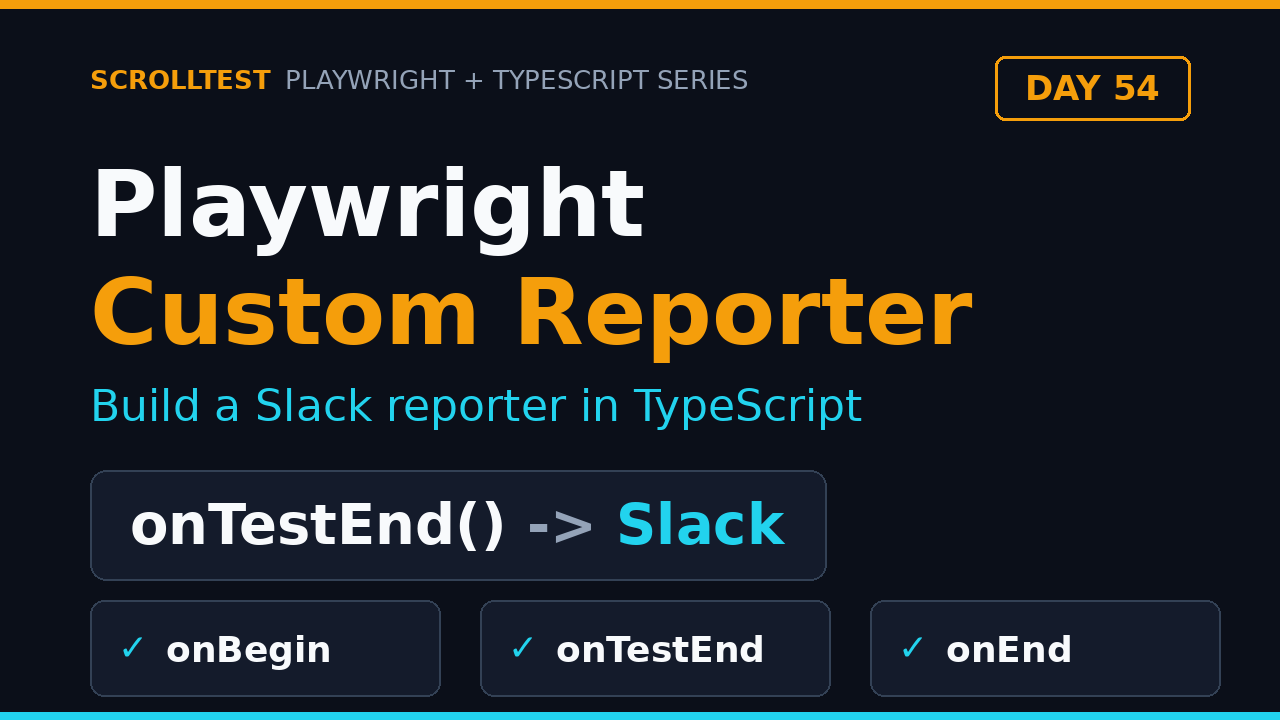
Your Playwright suite went red in CI at 2 a.m. and nobody noticed for three hours because the built-in HTML report lives on a server nobody opens until morning. A Playwright custom reporter fixes that. It is a TypeScript class that hooks into the test runner’s lifecycle and runs your own code the instant a test passes, fails, or the entire run finishes. In this tutorial I walk through the exact Reporter API, then we build a Slack reporter that pings your team the moment a flaky test crosses the line. By the end you will have a working custom reporter wired into your own config.
Table of Contents
- What Is a Playwright Custom Reporter?
- The Reporter API: The 5 Hooks That Matter
- Your First Custom Reporter in 15 Lines
- Building a Slack Reporter in TypeScript
- Tracking Custom Metrics: Duration, Flakiness, and Retries
- Combining Reporters: Keep the HTML, Add Slack
- Reporter vs Fixtures: Where Does the Logic Belong?
- Five Pitfalls That Break Custom Reporters
- India Context: What SDET Hiring Managers Want
- Key Takeaways
- FAQ
Contents
What Is a Playwright Custom Reporter?
Every Playwright run produces test results. The built-in reporters decide how those results get shown. Playwright ships list, line, dot, json, junit, html, and blob out of the box. They print to the terminal or write files to disk. A Playwright custom reporter replaces or extends that behavior with your own logic.
Under the hood a reporter is just an object that implements the Reporter interface from @playwright/test/reporter. The test runner calls its methods at specific points during a run. You decide what happens at each point: send a Slack message, write a row to a database, increment a Prometheus counter, or fail a release gate when a threshold breaks.
The stakes are real. Playwright has passed 94,000 stars on GitHub, and @playwright/test now moves about 201 million downloads a month on npm. That means thousands of teams are running this exact lifecycle every day, and a custom reporter is the cheapest way to make those runs useful to the rest of your team.
Here is why teams build one instead of relying on the HTML report:
- Push over pull. The HTML report waits for a human to open it. A custom reporter pushes failures to Slack, Teams, or email the second they happen.
- Custom metrics. You can track exactly what your team cares about: slowest 10 tests, flaky test count, pass rate per project, retry cost in minutes.
- Release gates. A reporter can inspect
FullResultat the end and exit the pipeline with a clear signal when quality drops below a threshold. - Internal tooling. Many QA teams pipe results into their own dashboards, Jira, or TestRail instead of a static report file.
It helps to know that every report you have ever used in Playwright is built on this same interface. The built-in html reporter, the junit reporter, and third-party tools like Allure and ReportPortal all implement Reporter. Once you understand the interface, you can replace any of them or sit alongside them.
If you have ever used the Allure reporting guide for Playwright, you already know the value of a rich report. Allure is itself a custom reporter. Today you learn to write your own.
The Reporter API: The 5 Hooks That Matter
The Reporter interface is documented at playwright.dev/docs/api/class-reporter. You rarely implement all of it. These five methods cover 95 percent of real use cases:
onBegin(config, suite)fires once when the run starts. Use it to log the total test count or send a “run started” message.onTestBegin(test, result)fires before each test. Use it for fine-grained tracking or starting timers.onTestEnd(test, result)fires after each test. This is where you readresult.statusandresult.durationand react to failures.onEnd(result)fires once when the whole run finishes. Use it to compute and send a final summary.printsToStdio()returns a boolean. Returntrueonly if your reporter writes to the terminal, otherwise the runner may interfere with output ordering.
The objects you receive are typed. FullConfig carries workers and project metadata. Suite exposes allTests(). TestCase gives you title, location, and annotations. TestResult carries status, duration, retry, attachments, and error. FullResult has an overall status and duration for the run.
A result status is one of passed, failed, timedOut, skipped, or interrupted. That enumeration matters when you filter, because a timed out test is not the same as a failed one in most dashboards.
Your First Custom Reporter in 15 Lines
Create my-reporter.ts in your project root. A minimal reporter looks like this:
import type {
  Reporter,
  FullConfig,
  Suite,
  TestCase,
  TestResult,
  FullResult,
} from '@playwright/test/reporter';

class MyReporter implements Reporter {
  onBegin(config: FullConfig, suite: Suite) {
    console.log(`Starting run with ${suite.allTests().length} tests`);
  }

  onTestEnd(test: TestCase, result: TestResult) {
    const status = result.status.toUpperCase();
    console.log(`${status}: ${test.title} (${result.duration}ms)`);
  }

  onEnd(result: FullResult) {
    console.log(`Finished: ${result.status} in ${result.duration}ms`);
  }
}

export default MyReporter;
Now register it in playwright.config.ts:
import { defineConfig } from '@playwright/test';

export default defineConfig({
  reporter: [
    ['list'],
    ['./my-reporter.ts'],
  ],
});
Run npx playwright test and you will see your own lines mixed into the output. The list reporter still prints its usual summary, and your reporter adds the per-test status lines. That is the entire mental model: the runner walks the lifecycle, and your class reacts.
Building a Slack Reporter in TypeScript
The most common production use case I see is a Slack alert on failure. The reporter checks result.status in onTestEnd, and when a test fails for good, it posts a message to a Slack incoming webhook.
Two details make this correct. First, use result.retry so you only alert on the final failure, not the first attempt of a test that later passes on retry. Second, read the webhook URL from an environment variable so you never commit a secret.
import type {
  Reporter,
  TestCase,
  TestResult,
  FullResult,
} from '@playwright/test/reporter';

class SlackReporter implements Reporter {
  private failures: string[] = [];

  onTestEnd(test: TestCase, result: TestResult) {
    if (result.status === 'failed' || result.status === 'timedOut') {
      this.failures.push(
        `${test.titlePath().join(' > ')} (${result.duration}ms)`
      );
    }
  }

  async onEnd(result: FullResult) {
    if (result.status !== 'failed' || this.failures.length === 0) {
      return;
    }
    const url = process.env.SLACK_WEBHOOK_URL;
    if (!url) {
      console.warn('SLACK_WEBHOOK_URL not set, skipping alert');
      return;
    }
    const text = `:rotating_light: Playwright run failed (${result.status}).\n` +
      this.failures.slice(0, 5).map((f) => `- ${f}`).join('\n');
    await fetch(url, {
      method: 'POST',
      headers: { 'Content-Type': 'application/json' },
      body: JSON.stringify({ text }),
    });
  }
}

export default SlackReporter;
Register it the same way and set the environment variable in CI. Now a failure at 2 a.m. becomes a message in your #qa-alerts channel within seconds, complete with the failing test names and durations. That is the difference between finding out at breakfast and finding out immediately.
A few production-grade extras you can add:
- Link to the artifact. Include the CI run URL so engineers jump straight to the trace and video. This pairs well with the evidence pipeline I covered in the screenshots and video recording tutorial.
- Cap the message. Slice failures to the first five, then append “and N more” so a catastrophic run does not flood the channel.
- Dedupe flakes. Track tests that failed on attempt one but passed on retry, and post them under a separate “flaky” header.
To split flakes from hard failures, keep two arrays and classify in onTestEnd:
if (result.status === 'passed' && result.retry > 0) {
  this.flaky.push(test.title);
} else if (result.status === 'failed' || result.status === 'timedOut') {
  this.failures.push(test.title);
}
Then send two Slack blocks: hard failures under a red marker and flakes under a warning marker. Engineers ignore a channel that cries wolf, so keeping flakes visually separate keeps the hard-failure alerts credible over time.
Tracking Custom Metrics: Duration, Flakiness, and Retries
A reporter is also the cleanest place to compute numbers that the default reporters do not surface. The three metrics QA managers ask me about most are slowest tests, flaky tests, and total retry time.
import type { Reporter, TestCase, TestResult, FullResult } from '@playwright/test/reporter';

class MetricsReporter implements Reporter {
  private durations: { title: string; ms: number }[] = [];
  private flaky: string[] = [];
  private retryMs = 0;

  onTestEnd(test: TestCase, result: TestResult) {
    this.durations.push({ title: test.title, ms: result.duration });

    if (result.status === 'passed' && result.retry > 0) {
      this.flaky.push(test.title);
    }
    if (result.retry > 0) {
      this.retryMs += result.duration;
    }
  }

  onEnd(result: FullResult) {
    const slowest = [...this.durations]
      .sort((a, b) => b.ms - a.ms)
      .slice(0, 10);

    console.log('\n=== Custom Metrics ===');
    console.log(`Run status: ${result.status}`);
    console.log(`Flaky tests: ${this.flaky.length}`);
    console.log(`Retry time spent: ${(this.retryMs / 1000).toFixed(1)}s`);
    console.log('Slowest tests:');
    slowest.forEach((d) => console.log(`  ${d.ms}ms - ${d.title}`));
  }
}

export default MetricsReporter;
The flaky detection logic is worth understanding: a test is flaky when it failed on an earlier attempt but passed on a later one, which is exactly result.retry > 0 combined with a final passed status. Retry time is the sum of durations on every attempt beyond the first, and it is a direct measure of the CI minutes your flaky suite is burning.
If you are deep into making your suite stable, this reporter gives you the raw numbers to act on. It pairs well with the retry and flaky-test guidance in the tags and annotations tutorial, where you learn to quarantine flaky tests with annotations instead of deleting them.
If a console summary is not enough, the same data can be written to a JSON file that a dashboard ingests. Playwright ships a json reporter, but it dumps everything, including attachments. A small custom reporter gives you a clean, team-specific slice with only the fields you graph:
import { writeFileSync } from 'node:fs';
import type { Reporter, TestCase, TestResult, FullResult } from '@playwright/test/reporter';

interface Metric {
  title: string;
  status: string;
  durationMs: number;
  retry: number;
}

class JsonMetricsReporter implements Reporter {
  private tests: Metric[] = [];

  onTestEnd(test: TestCase, result: TestResult) {
    this.tests.push({
      title: test.title,
      status: result.status,
      durationMs: result.duration,
      retry: result.retry,
    });
  }

  onEnd(result: FullResult) {
    const payload = {
      status: result.status,
      durationMs: result.duration,
      total: this.tests.length,
      passed: this.tests.filter((t) => t.status === 'passed').length,
      failed: this.tests.filter(
        (t) => t.status === 'failed' || t.status === 'timedOut'
      ).length,
      tests: this.tests,
    };
    writeFileSync('test-results/metrics.json', JSON.stringify(payload, null, 2));
  }
}

export default JsonMetricsReporter;
Point a CI step or a Grafana scrape at test-results/metrics.json and you have a daily pass-rate trend with zero extra test tooling. This is how I track whether the suite is getting healthier week over week instead of just hoping it is.
Combining Reporters: Keep the HTML, Add Slack
You do not have to choose between the HTML report and your Slack alerts. Playwright supports an array of reporters, each with its own options object. The first element is the reporter name or path, the second is an options object passed to the reporter.
export default defineConfig({
  reporter: [
    ['html', { open: 'never' }],
    ['list'],
    ['./reporters/slack-reporter.ts', { channel: 'qa-alerts' }],
    ['./reporters/metrics-reporter.ts', { thresholdMs: 30000 }],
  ],
});
Your custom reporter receives the options object as the first argument to its constructor:
class SlackReporter implements Reporter {
  private channel: string;

  constructor(options: { channel?: string } = {}) {
    this.channel = options.channel ?? 'qa-alerts';
  }
}
This pattern keeps one HTML report for human debugging and one Slack push for real-time awareness, running from the same test execution with zero extra runs. It is the setup I recommend for every team moving to CI-driven quality gates.
Reporter vs Fixtures: Where Does the Logic Belong?
A question I get from teams new to Playwright is why they should write a custom reporter at all when they already have fixtures and beforeEach hooks. The two solve different problems, and mixing them up is a common source of tangled test code.
Fixtures and hooks run inside a worker, for a specific test, and they have access to the page and browser context. They are the right place for per-test setup and teardown: logging in, seeding data, cleaning up state after the test. A reporter, in contrast, runs outside the test lifecycle, one instance per run, and it sees results, not pages. You cannot open a page inside onTestEnd, and you do not want to send a Slack message from inside a fixture because you would send one per test attempt with no global summary at the end.
Here is the rule I apply:
- Does it touch the page or browser? Use a fixture or hook.
- Does it react to a result or aggregate the whole run? Use a reporter.
- Does it need to run once per project instead of once per test? Use a reporter, or a
globalSetupif it does not read results.
Concretely, screenshot-on-failure belongs in an afterEach hook because it needs the page and the current test result. A Slack summary belongs in a reporter because it needs the aggregate result of the whole run. Getting this split right is what separates a clean framework from a tangled one, and it is the first thing I look at when I review a team’s Playwright setup.
Five Pitfalls That Break Custom Reporters
Every custom reporter I have written has hit at least one of these. Save yourself the debugging time:
- Forgetting
printsToStdio(). If your reporter writes to stdout and does not returntrue, the runner cannot guarantee clean ordering, and your lines can interleave with other reporters. - Unawaited async in
onEnd. The process can exit before your Slack fetch finishes. Return the promise from the hook so the runner awaits it. The official test-reporters guide calls this out explicitly. - Throwing inside a hook. An exception in
onTestEndcan abort the whole run. Wrap risky logic in try/catch and log the error instead of throwing. - Hardcoding secrets. Never paste a webhook URL into the reporter file. Read it from
process.envand fail loudly when it is missing. - Treating
result.erroras a string. It is an object withmessageandstackfields. Printing the object directly gives you[object Object]in your Slack message. - Ignoring
onStdOutandonStdErr. Console output from your tests flows through these hooks. Skip them and your report loses the exact log lines that explain a failure.
Each of these is a silent failure: the reporter exists, the tests run, but the alert never lands or the output looks corrupted. Test your reporter with a deliberately failing test before you trust it in production.
India Context: What SDET Hiring Managers Want
In Bengaluru and Pune, a candidate who can talk through a custom reporter stands out immediately. Most automation engineers have only ever configured the built-in html reporter. The moment you explain how you wired onTestEnd to a Slack webhook and added a retry-cost metric, you signal ownership of the whole pipeline, not just the test scripts.
This matters for compensation. SDET roles that expect framework and reporting ownership in India commonly range from ₹15 LPA for early SDETs up to ₹35 LPA and beyond for senior SDETs who own CI, reporting, and flakiness strategy. Reporting is one of the cheapest ways to move from “I write tests” to “I own the quality signal”, and hiring managers read that as senior.
Two interview questions I hear repeated on this exact topic:
- “How do you notify the team when a test fails in CI?” A weak answer is “we open the report”. A strong answer is the Slack reporter you just built.
- “How do you measure flakiness?” A weak answer is “some tests are flaky”. A strong answer is “I track retry attempts and pass-after-retry in a custom reporter and graph it.”
If you are preparing for SDET interviews, fold this into your story. The trace viewer debugging tutorial covers the other half of the same story: what you do once that Slack message arrives.
The fastest way to demonstrate this in an interview is to walk through the onTestEnd to Slack flow, then mention the retry-cost metric. That two-minute explanation covers reporting, flakiness, and CI awareness in one story, which is usually three separate competency questions on an SDET panel.
Key Takeaways
- A Playwright custom reporter is a class that implements the
Reporterinterface and reacts to the run lifecycle. - The five hooks that matter are
onBegin,onTestBegin,onTestEnd,onEnd, andprintsToStdio. - A Slack reporter gives you real-time failure alerts, which beats waiting for someone to open an HTML report.
- Use
result.retryto separate true failures from flaky tests and to measure retry cost. - Combine reporters in an array so you keep the HTML report and add Slack without an extra run.
- Never hardcode secrets, always await async hooks, and wrap risky logic in try/catch.
FAQ
Where do I put my custom reporter file?
Anywhere in your project, but I keep them in a reporters/ folder and reference them by relative path in playwright.config.ts. TypeScript compiles them through the same ts-node pipeline as your tests.
Can I have more than one custom reporter?
Yes. The reporter array accepts as many entries as you want, each with its own options object. Run a Slack reporter, a metrics reporter, and the built-in HTML reporter side by side.
Do custom reporters work with sharded runs?
Each shard runs its own reporter and sees only its own tests. If you need merged metrics across shards, write a blob report per shard and merge, then compute metrics from the merged data. For Slack alerts, per-shard reporting is usually fine because you want the failing shard to ping immediately.
Is result.retry the right way to detect flakes?
For most teams, yes. A test that failed on attempt one and passed on a later attempt shows retry > 0 with a final passed status. For deeper analysis you can combine it with the trace attachments the runner already produces.
Do custom reporters slow down the test run?
Not meaningfully. The hooks run in milliseconds per test, and the only real cost is async work in onEnd, like a Slack fetch, which delays just the end of the run. Keep per-test hooks light and do heavy aggregation in onEnd.
This is Day 54 of the Playwright + TypeScript tutorial series. The series ships a new hands-on topic every day, from setup to CI. Want the full curriculum in one place? Follow along at scrolltest.com.


