AI Observability for QA: Testing LLM Apps in Production
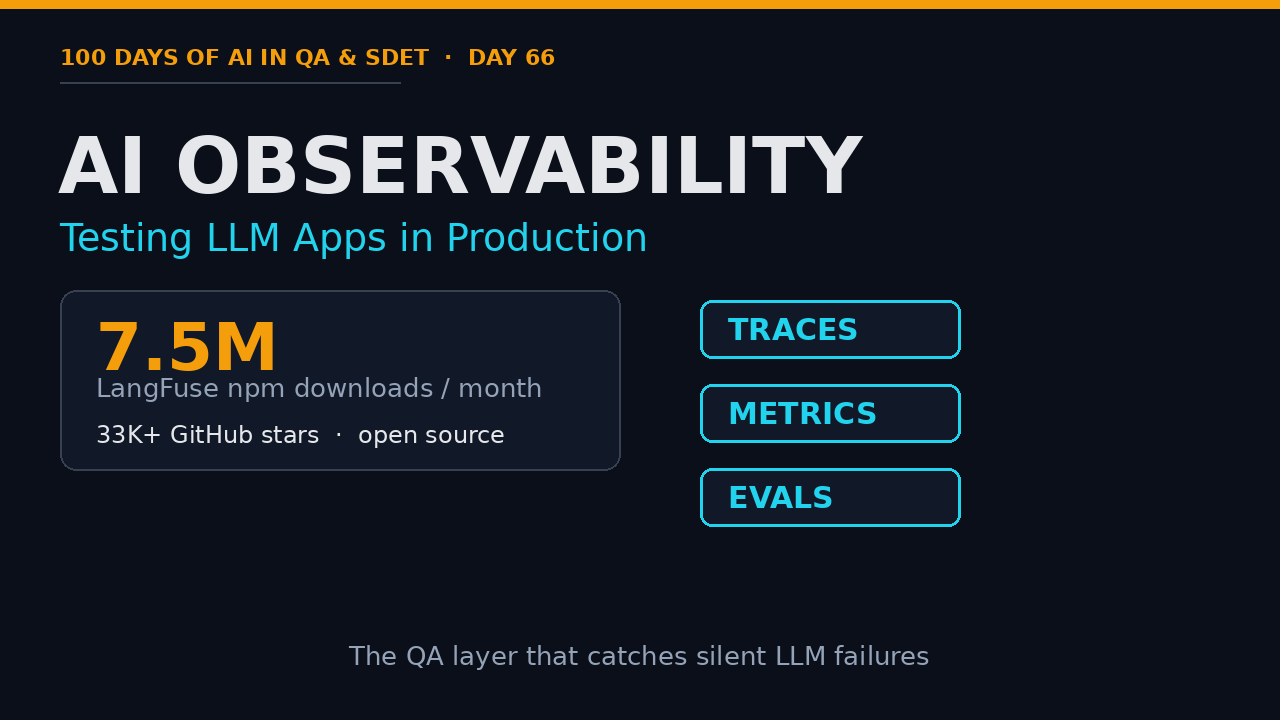
Table of Contents
- What Is AI Observability (and Why It Is Not Just Logging)
- Why QA Engineers Suddenly Own This Layer
- The Three Signals Every AI QA Team Must Track
- The Tool Landscape: LangSmith vs LangFuse vs Phoenix
- Instrumenting Your First Trace in Python
- An Observability-Driven QA Checklist
- India Context: AI QA Hiring Rewards Observability Skills
- Common Mistakes When Teams Start AI Observability
- Key Takeaways
- FAQ
Here is the uncomfortable truth I keep running into on real projects: most teams ship an LLM feature, eyeball a few outputs in a notebook, and call it tested. Then the chatbot goes live, a user asks something slightly off the happy path, and the model silently returns a wrong answer with full confidence. Nobody notices for weeks because there is no observability, no trace, no score. AI observability is the layer that turns those silent failures into visible, triageable signals, and it is quickly becoming the most hireable skill a QA engineer can add in 2026.
Contents
What Is AI Observability (and Why It Is Not Just Logging)
Traditional logging tells you that a request happened. AI observability tells you what the model actually did, step by step, and whether that step was correct. When a user asks a RAG chatbot a question, a single “request” is actually a pipeline: retrieve documents, re-rank them, assemble a prompt, call the model, parse the response, and maybe call a tool. A plain log line at the edge of your API shows you the input and the output. It hides everything in the middle.
AI observability instruments the whole chain. It captures:
- Traces: the full tree of spans for one user request, from retrieval to final answer.
- Metrics: token counts, latency, cost per request, cache hit rates, model error rates.
- Evaluations: quality scores attached to specific traces, such as faithfulness, answer relevancy, or hallucination flags.
This matters because LLM failures do not look like classic software failures. A 500 error is obvious. A wrong-but-confident answer is not. I have seen support tickets pile up for a week before anyone realized a prompt change had quietly degraded retrieval quality by 18%. Without traces and scores, that regression is invisible.
The difference between monitoring and testing
Monitoring answers “is the system healthy right now.” Testing answers “is the system correct for this input.” AI observability sits between the two. It gives you the raw material to do both: you watch traces in production, and you replay the interesting ones back into your offline eval suite. If you only monitor dashboards, you will catch latency spikes but miss quality drops. If you only run offline evals, you will miss what real users actually ask. You need both, wired to the same traces.
Why QA Engineers Suddenly Own This Layer
I see a pattern on teams that are a year into building AI features. The ML engineers own the model. The backend engineers own the API. Nobody owns the behavior of the whole system. QA is the only role whose entire job is to reason about system behavior end to end, so the observability layer lands on us whether we asked for it or not.
There is a second, more selfish reason. Traditional test automation is commoditizing fast. A Playwright script that clicks a button is something a junior can write with an AI copilot in ten minutes. But knowing how to trace a RAG pipeline, read a span tree, and write an eval that catches a hallucination before a customer does? That is still rare. That is where the career upside, and the salary premium, now sits. I wrote about the memory layer of AI agents earlier in this series; observability is the sibling skill that makes every other AI testing skill actually useful, because you cannot improve what you cannot see.
Think about what happens without a clear owner. A model update changes the embedding model, retrieval returns slightly different chunks, and answer quality drifts. The ML team says the model improved. The backend team says the API works. Support says tickets are up but cannot say why. QA is the one who can pull the before-and-after traces, run the golden dataset through both versions, and point at the exact span where quality dropped. That evidence-gathering role is what QA was built for, and it is why I now treat AI observability as a core QA competency, not a DevOps nice-to-have.
The Three Signals Every AI QA Team Must Track
I reduce AI observability to three signals. If you track all three, you have enough to triage almost any production issue. Miss one, and you will be flying blind on that axis.
Traces: the full chain of one user request
A trace is a tree of spans. Each span is a step: a retrieval call, a re-rank, a model generation, a tool invocation. The parent-child structure tells you the sequence and the dependencies. When a user reports “the bot gave a weird answer,” the first thing I do is pull that trace and walk the tree from root to leaf. Nine times out of ten, the problem is not the model. It is the retrieval step returning the wrong documents, or a tool returning an empty result, or a prompt template that got cut off.
Without the trace, every debugging session starts with a guess. With the trace, you start with evidence.
Metrics: tokens, cost, and latency
Metrics are the quantitative layer. The numbers I care about first:
- Tokens in and tokens out: higher output tokens usually mean higher cost and higher latency.
- Latency: p50 and p95 per span, not just per request. A slow re-ranker hides inside a fast overall request.
- Cost per request: a single user session that triggers ten tool calls can cost ten times a simple completion.
- Error and retry rates: model timeouts, rate limits, and tool failures.
These are the numbers that catch regressions before a human ever reads an output. A release that triples average token count is a cost and latency incident waiting to happen, even if every answer is still correct.
Here is a real number from a client project. A single RAG request that naively stuffed five full documents into the prompt was consuming roughly 9,000 tokens per turn. After we added a re-ranker that kept only the top three chunks, the same request dropped to about 3,200 tokens. Same answer quality, one-third the cost, and p95 latency fell by 41%. None of that was visible until we had per-span token and latency metrics sitting in a trace. This is the difference between guessing at optimization and measuring it.
Evals: quality scores attached to traces
Traces and metrics tell you what happened. Evals tell you whether it was good. You attach a score to a trace: faithfulness (does the answer stay true to the retrieved context), answer relevancy, context precision, or a plain hallucination flag. I covered how to build these with DeepEval and how to wire them into CI with PromptFoo regression pipelines in earlier posts. The key shift is to run evals both offline (on a golden dataset) and online (sampling live traces), because real user traffic will find inputs your golden set never imagined.
The Tool Landscape: LangSmith vs LangFuse vs Phoenix
There are three serious options most QA teams weigh in 2026, plus a vendor-neutral standard underneath them. My honest read, based on what I have run in projects:
LangSmith (SaaS)
LangSmith is LangChain’s hosted platform. It is the smoothest on-ramp if you already build on LangChain or LangGraph, because tracing is close to automatic. You get traces, evals, datasets, and prompt management in one UI. The trade-off is that it is a closed, hosted service; your trace data lives with a vendor, and the free tier caps usage. For a team that wants observability with minimal setup and already lives in the LangChain ecosystem, it is hard to beat. Docs live at docs.smith.langchain.com.
LangFuse (open source)
LangFuse is the open-source option that has taken off. The repo has passed 33,000 GitHub stars, and the npm package was downloaded roughly 7.5 million times in the last month alone. It gives you tracing, evals, prompt management, and LLM-as-a-judge scoring, and you can self-host it if your data cannot leave your VPC. If you are in banking, healthcare, or an enterprise that refuses to ship traces to a third party, self-hosted LangFuse is usually the answer. I reach for it first when a client has a data-residency constraint.
Arize Phoenix (open source)
Phoenix comes from the ML observability world, so its strengths are experiment tracking and model-level debugging, not just LLM app tracing. It has over 11,000 GitHub stars and is Apache 2.0 licensed. If your team ships a mix of classical ML models and LLM features, Phoenix gives you one place to see both. For pure LLM apps, LangFuse and LangSmith are more focused, but Phoenix is a solid open choice.
The vendor-neutral layer: OpenTelemetry GenAI conventions
Underneath all of these sits a standard worth knowing. OpenTelemetry, the CNCF observability framework, has a dedicated set of Generative AI semantic conventions that define spans like gen_ai.operation.name and metrics like token usage and prompt/cache/completion tokens. Why does this matter for QA? Because a trace instrumented with standard attributes can be exported to LangFuse, Phoenix, or any OTLP-compatible backend. You avoid vendor lock-in at the instrumentation layer. Learn the conventions once, and your traces are portable.
So which one do you pick? My working rule, stated plainly:
- LangChain or LangGraph shop that wants zero setup: LangSmith.
- Data cannot leave your VPC, or you want to self-host: LangFuse.
- Mixed ML and LLM workloads, or you want a pure Apache 2.0 option: Arize Phoenix.
- Vendor lock-in is a hard no: instrument with OpenTelemetry GenAI conventions and choose the backend later.
You do not have to commit forever. The whole point of the OpenTelemetry layer is that your instrumentation outlives your dashboard choice.
Instrumenting Your First Trace in Python
You do not need to re-architect anything to get your first trace. Here is a minimal LangFuse instrumented RAG pipeline in Python. The decorator wraps each function as a span, and the parent-child relationship is built automatically from the call stack.
from langfuse import Langfuse
from langfuse.decorators import observe

langfuse = Langfuse(public_key="pk-lf-...", secret_key="sk-lf-...")

@observe()
def retrieve(query: str) -> list[str]:
    # your vector DB call goes here
    return search_index(query, top_k=5)

@observe()
def generate(context: list[str], query: str) -> str:
    # your LLM call goes here
    return model.complete(prompt=build_prompt(context, query))

@observe()
def rag_pipeline(query: str) -> dict:
    docs = retrieve(query)
    answer = generate(docs, query)
    return {"answer": answer, "sources": docs}
That is it. Each call to rag_pipeline now produces a trace with three spans, and LangFuse records token counts, latency, and cost automatically from the LLM call. Once you have traces, attach a score to close the loop:
@observe()
def rag_pipeline(query: str) -> dict:
    docs = retrieve(query)
    answer = generate(docs, query)
    # score faithfulness against the retrieved context
    langfuse.score(
        trace_id=langfuse.get_trace_id(),
        name="faithfulness",
        value=score_faithfulness(answer, docs),
    )
    return {"answer": answer, "sources": docs}
Now every production trace carries a quality signal, and you can slice by score in the dashboard to find the worst answers your users are actually hitting. If you prefer a vendor-neutral path, the same idea works with OpenTelemetry:
from opentelemetry import trace
from opentelemetry.sdk.trace import TracerProvider
from opentelemetry.sdk.trace.export import BatchSpanProcessor
from opentelemetry.exporter.otlp.proto.grpc.trace_exporter import OTLPSpanExporter

trace.set_tracer_provider(TracerProvider())
trace.get_tracer_provider().add_span_processor(
    BatchSpanProcessor(OTLPSpanExporter(endpoint="http://localhost:4317"))
)
tracer = trace.get_tracer("rag-service")

with tracer.start_as_current_span("rag.retrieve") as span:
    span.set_attribute("gen_ai.operation.name", "retrieval")
    docs = search_index(query, top_k=5)
Export that to LangFuse, Phoenix, or any OTLP backend and your spans carry the standard gen_ai.* attributes. Same traces, no vendor lock-in.
An Observability-Driven QA Checklist
When I audit an AI feature before it ships, here is the checklist I run. It is deliberately concrete so you can paste it into a release gate.
- Every user-facing LLM call is traced end to end, including retrieval, tool calls, and re-ranking steps.
- Each span records token counts and latency, so cost and speed regressions show up in a diff.
- At least one eval score (faithfulness or answer relevancy) is attached to production traces, not just offline runs.
- A golden dataset runs in CI on every prompt or model change, with a pass threshold enforced.
- Errors are separated from bad answers: a timeout is a different alert than a hallucination, and they go to different owners.
- Traces are replayable: you can export a production trace and re-run it through the eval suite.
If a team checks all six boxes, I can sleep at night. If they check only the first two, they have monitoring, not observability, and the first quality regression will still blindside them.
India Context: AI QA Hiring Rewards Observability Skills
The Indian QA job market is moving fast on this. In Bengaluru and Hyderabad, I now see AI testing roles that list LangSmith, LangFuse, or OpenTelemetry experience as a differentiator, not a nice-to-have. The pattern mirrors what happened with Selenium a decade ago: the tool itself is easy to learn, but the engineers who can wire it into a real pipeline command a premium.
A senior SDET who can instrument an LLM app, set up evals in CI, and read a span tree to find a hallucination is currently in far shorter supply than the number of product companies shipping AI features. In my experience, that skill set maps to the upper end of the ₹25-40 LPA band for senior SDETs, and it is one of the fastest ways for a mid-level automation tester to reposition as an AI testing engineer. The demand is coming from product companies first; services firms like TCS and Infosys are a year or two behind, which is exactly the window you want to use to get ahead.
If you want to make this concrete on your resume, list the stack: LangFuse or LangSmith for tracing, OpenTelemetry GenAI conventions for instrumentation, and an eval framework like DeepEval or PromptFoo wired into CI. That one line signals you can do more than click a button; it signals you can own the quality of an AI system end to end.
Common Mistakes When Teams Start AI Observability
I have made most of these mistakes myself, so here they are so you can skip them:
- Instrumenting everything but reading nothing. Collecting traces nobody opens is the fastest way to burn budget on a dashboard nobody uses.
- Monitoring latency and cost, ignoring quality. Your dashboards stay green while your users get wrong answers.
- Only running evals offline. Real traffic finds inputs your golden set never covered. Sample live traces or you will miss the failures that matter.
- Alerting on every low score. A single bad answer is noise. Alert on aggregates and trends, not individual traces, unless you triage them manually.
- Skipping the trace-level link in bug reports. A user complaint without the trace is a guessing game. Wire the trace ID into your support flow.
The one that costs teams the most is the second: monitoring the pipes instead of the answers. Cost and latency are easy to chart, so teams chart them first and never get around to scoring quality. That is how you ship a fast, cheap, confidently wrong chatbot.
Key Takeaways
- AI observability means traces, metrics, and evals wired to the same request, not just log lines.
- QA engineers own this layer because nobody else reasons about whole-system behavior end to end.
- LangFuse (open source, 33k stars), LangSmith (SaaS), and Phoenix (open source) are the three tools to know; OpenTelemetry GenAI conventions keep you portable.
- Attach at least one quality score to production traces, and enforce a golden dataset in CI.
- This is the fastest lever for an Indian automation tester to move into an AI testing role.
FAQ
Is AI observability the same as LLM monitoring?
Not quite. Monitoring tracks health metrics like latency and error rate. AI observability adds traces and quality evals so you can see why a response was wrong, not just that something slowed down.
Do I need AI observability if my app only does simple completions?
Start light, but yes. Even a simple completion has a prompt, a model, and a quality bar. The moment you add retrieval or tool calls, traces become non-negotiable.
Which tool should a beginner pick first?
If you build on LangChain, start with LangSmith. If you need self-hosting or want open source, pick LangFuse. Either way, learn the OpenTelemetry GenAI conventions so the choice is not permanent.
How is this different from the eval frameworks I already use?
Frameworks like DeepEval and PromptFoo produce scores. AI observability captures the traces and metrics those scores attach to, and surfaces them in production. They are complementary, not competing; you want both.
Can I add observability without changing my model code?
Mostly. Decorators and auto-instrumentation wrap your existing functions. The main work is deciding which spans to create and which scores to attach, not rewriting your pipeline.